Uncategorized

New paper – Trends and indicators for quantifying moth abundance and occupancy in Scotland

Byron Morgan and Emily Dennis have had a paper published in Journal of Insect Conservation.

The full paper can be accessed here.

Trends and indicators for quantifying moth abundance and occupancy in Scotland

E. B. Dennis, T. M. Brereton, B. J. T. Morgan, R. Fox, C. R. Shortall, T. Prescott, S. Foster

Moths form an important part of Scotland’s biodiversity and an up-to-date assessment of their status is needed given their value as a diverse and species-rich taxon, with various ecosystem roles, and the known decline of moths within Britain. We use long-term citizen-science data to produce species-level trends and multi-species indicators for moths in Scotland, to assess population (abundance) and distribution (occupancy) changes. Abundance trends for moths in Scotland are produced using Rothamsted Insect Survey count data, and, for the first time, occupancy models are used to estimate occupancy trends for moths in Scotland, using opportunistic records from the National Moth Recording Scheme. Species-level trends are combined to produce abundance and occupancy indicators. The associated uncertainty is estimated using a parametric bootstrap approach, and comparisons are made with alternative published approaches. Overall moth abundance (based on 176 species) in Scotland decreased by 20% for 1975–2014 and by 46% for 1990–2014. The occupancy indicator (based on 230 species) showed a 16% increase for 1990–2014. Alternative methods produced similar indicators and conclusions, suggesting robustness of the results, although rare species may be under-represented in our analyses. Species abundance and occupancy trends were not clearly correlated; in particular species with negative population trends showed varied occupancy responses. Further research into the drivers of moth population changes is required, but increasing occupancy is likely to be driven by a warming summer climate facilitating range expansion, whereas population declines may be driven by reductions in habitat quality, changes in land management practices and warmer, wetter winters.

Standard
Uncategorized

New paper – Exact inference for integrated population modelling

Takis Besbeas and Byron Morgan have recently published a paper in Biometrics developing an approach for exact inference for integrated modelling.

The paper can be accessed here.

Exact inference for integrated population modelling

Integrated population modelling is widely used in statistical ecology. It allows data from population time series and independent surveys to be analysed simultaneously. In classical analysis the time‐series likelihood component can be conveniently approximated using Kalman filter methodology. However, the natural way to model systems which have a discrete state space is to use hidden Markov models (HMMs). The proposed method avoids the Kalman filter approximations and Monte Carlo simulations. Subject to possible numerical sensitivity analysis, it is exact, flexible, and allows the use of standard techniques of classical inference. We apply the approach to data on Little owls, where the model is shown to require a one‐dimensional state space, and Northern lapwings, with a two‐dimensional state space. In the former example the method identifies a parameter redundancy which changes the perception of the data needed to estimate immigration in integrated population modelling. The latter example may be analysed using either first‐ or second‐order HMMs, describing numbers of one‐year olds and adults or adults only, respectively. The use of first‐order chains is found to be more efficient, mainly due to the smaller number of one‐year olds than adults in this application. For the lapwing modelling it is necessary to group the states in order to reduce the large dimension of the state space. Results check with Bayesian and Kalman filter analyses, and avenues for future research are identified


Standard
Uncategorized

New paper – Functional data analysis of multi-species abundance and occupancy data sets

Emily Dennis (Butterfly Conservation) and Byron Morgan (SE@K) have recently published a paper in Ecological Indicators exploring multi-species abundance and occupancy indices using Functional Data Analysis tools.

The full paper can be accessed here.

Functional data analysis of multi-species abundance and occupancy data sets

Emily B.Dennis, Byron J.T.Morgan, RichardFox, David B.Roy and Tom M.Brereton

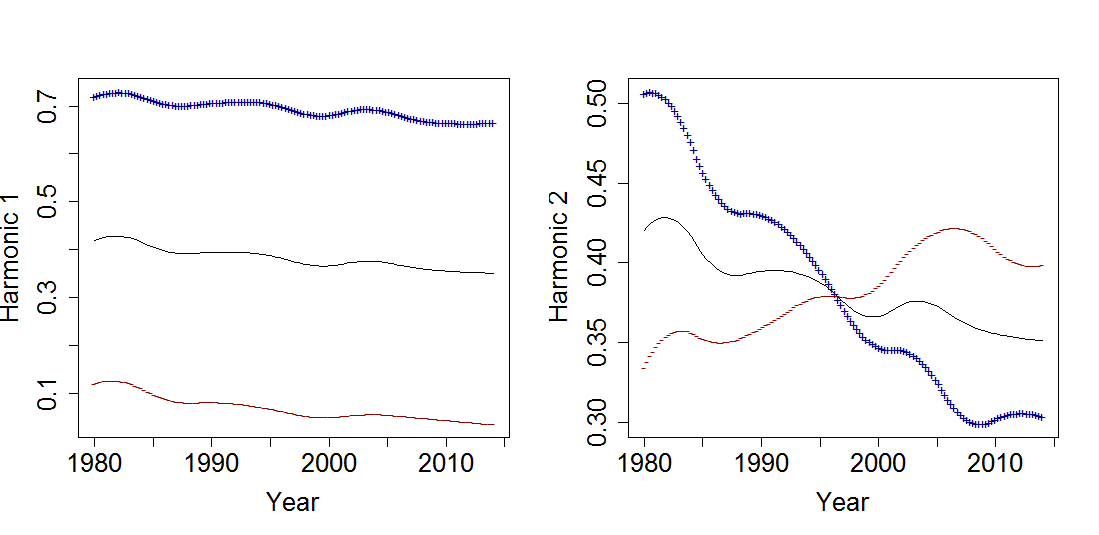
Multi-species indicators are widely used to condense large, complex amounts of information on multiple separate species by forming a single index to inform research, policy and management. Much detail is typically lost when such indices are constructed. Here we investigate the potential of Functional Data Analysis, focussing upon Functional Principal Component Analysis (FPCA), which can be easily carried out using standard R programs, as a tool for displaying features of the underlying information. Illustrations are provided using data from the UK Butterflies for the New Millennium and UK Butterfly Monitoring Scheme databases. The FPCAs conducted result in a huge simplification in terms of dimensional reduction, allowing species occupancy and abundance to be reduced to two and three dimensions, respectively. We show that a functional principal component arises for both occupancy and abundance analyses that distinguishes between species that increase or decrease over time, and that it differs from percentage trend, which is a simplification of complex temporal changes. We find differences in species patterns of occupancy and abundance, providing a warning against routinely combining both types of index within multi-species indicators, for example when using occupancy as a proxy for abundance when insufficient abundance data are available. By identifying the differences between species, figures displaying functional principal component scores are much more informative than the simple bar plots of percentages of significant trends that often accompany multi-species indicators. Informed by the outcomes of the FPCA, we make recommendations for accompanying visualisations for multi-species indicators, and discuss how these are likely to be context and audience specific. We show that, in the absence of FPCA, using mean species occupancy and total abundance can provide additional, accessible information to complement species-level trends. At the simplest level, we suggest using jitter plots to display variation in species-level trends. We encourage further application to other taxa, and recommend the routine augmentation of multi-species indicators in the future with additional statistical procedures and figures, to serve as an aid to improve communication and understanding of biodiversity metrics, as well as reveal potentially hidden patterns of behaviour and guide additional directions for investigation.

 

Standard