 We often discuss the variety of items, subjects, themes and genres that appear in the Lady’s Magazine. Each seemingly transparent topic can be found within an array of genres; for example, the topic of ‘fashion’ appears in items ranging from the moral essay and advice column to the opinion piece, historical essay and fashion report. Deciding which genre an item belongs to in the magazine is a task at times difficult to negotiate. This is in part because genres overlap and are by nature flexible; designating a particular item either a sentimental tale or a moral tale is thus not always simple or clear. Assigning works a genre requires that one privilege a particular genre over another, making decisions at once about authorial intent, editorial preference and reader perceptions.
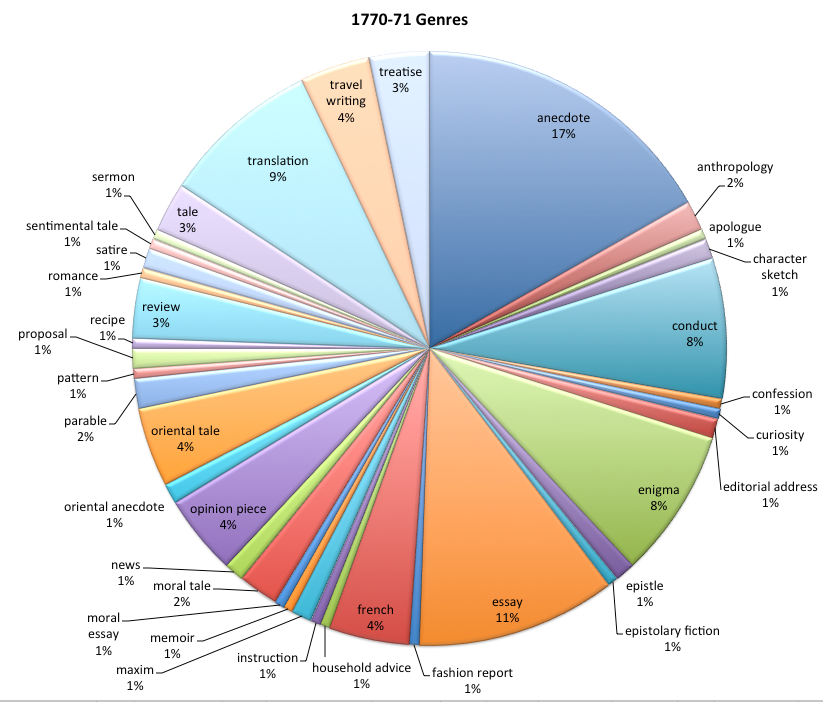
Yet once the difficult decisions are made, how can we disseminate a database with tens of thousands of items, belonging to dozens of distinct genres, into readily comprehensible information? The pie chart is a simple yet effective research tool that allows the different genres in the Lady’s Magazine to be visualized. In 1770-71, for example, the magazine was largely made up of anecdotes, essays and translations, followed by enigmas and conduct items.
In comparison, in this sample chart for 1771, it is easy to see that the majority of the magazine’s items are now essays or moral essays, followed by enigmas, translations and reviews. And of course, because enigmas are short in comparison to the lengthier essays, translations and reviews, it is these latter three genres that made up the bulk of the magazine’s content in its second year of publication. Anecdotes in 1771 make up only 5% of the magazine, in comparison to 17% the previous year. 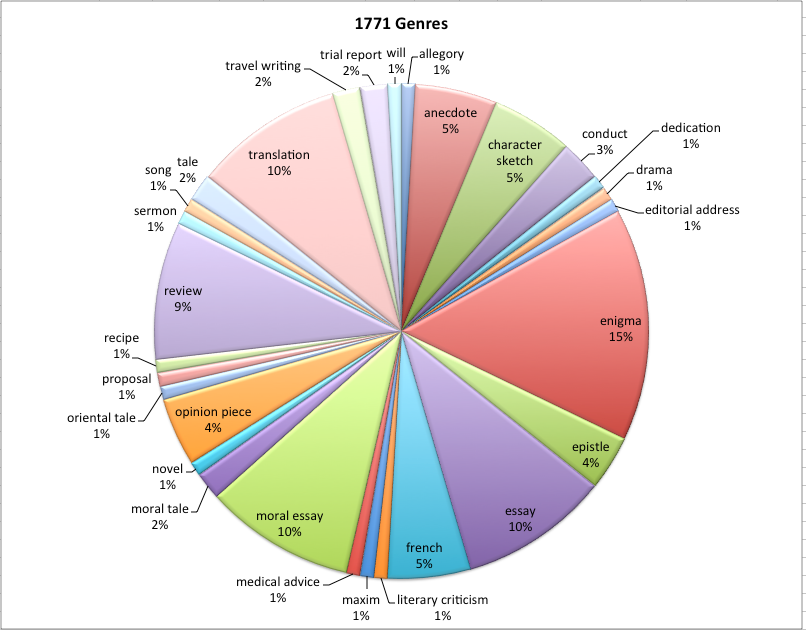
One of the key aspects of my research on the project is not only to analyse the items in order to assign them genres, but also to examine how the magazine’s generic composition evolves over the five decades of shifting literary tastes and political, social and cultural revolutions of its first series. Although this is a difficult task to negotiate, by breaking down the magazine’s generic makeup for each year in a pie chart, one can readily see what types of items could be found in the magazine. From here, it is easier to extrapolate the larger shifts in genres over the magazine’s print run. The dramatic decrease in the number of anecdotes from the first to second year, for example, could be explained by the magazine’s increasing readership and correspondingly larger number of contributors of original essays and fiction that meant the editors could rely less on extracted and popular anecdotes as material.
The most striking aspect of the pie chart created for 1790 is, I believe, the greater number of distinct genres in the magazine. Twenty years into its publication, the periodical was clearly comfortable with its position in the literary marketplace and the editors and publishers felt secure enough to print an even greater variety of genres and items. Also interesting is that, in the key historical moment, the number of translations (usually from the French) has dwindled to only 1% of the magazine.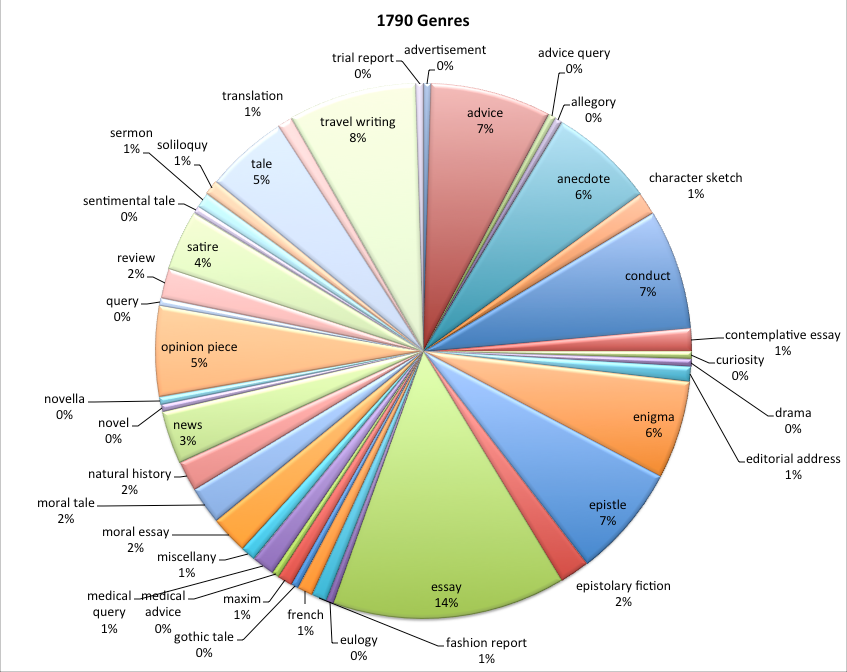
This is only a snapshot of one aspect of our research on the magazine’s composition and genres, but it allows the scope and quantity of data on genres to be readily perceived and is useful in analyzing the evolutions and in disseminating the results to other researchers and the public.
Jenny DiPlacidi
University of Kent
I found this fascinating Jenny! Especially the massive drop off in translations, which I would not have predicted (as someone who worked a little on that aspect of the magazine). One thing must surely big the big serialised translation of Genlis’s Adelaide and Theodore comes to an end in the 1790s. But what’s the patterns for the 1800-1830 period? I know translation is still there, but I’d love to see a pie chart for that.
This is wonderful. Comparative pie charts works beautifully to show changes in genre. Thanks for this.