For some time we’ve been aware of the effects of ZFS Fragmentation, which typically becomes an issue as a zpool passes 80% full, although we’ve seen it start anywhere between 70% and over 90% depending on the workload. Typically, you see degradation of performance and increased IO load as disk writes require finding and sticking together small chunks of free space. There’s a good summary of the gory technical details here.
The proper fix for this is to have a separate ZFS Intent Log (ZIL) device but given the number of physical and virtual servers we have that utilise ZFS root disks, this isn’t practical. Unfortunately, this also doesn’t fix the issue for existing pools and there’s no ZFS defragmentation tool. To resolve the issue you need to delete data or present additional storage.
The following charts neatly identify this issue – the volume below had a pair of competing jobs – one doing a lot of reads (green), and one doing a small amount of write I/O (blue, negative axis). A new volume was presented and attached to the zpool at 12:00.
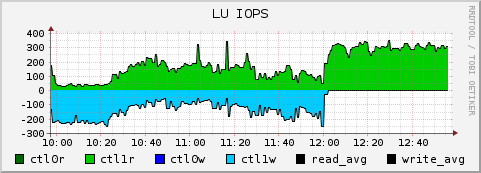
At this point the writes stopped going to the existing fragmented disk, freeing up a couple of hundred IOPS for the read job (to the point that is now CPU-bound). In the chart below, you can see the massively reduced write operations on the new unfragmented volume:
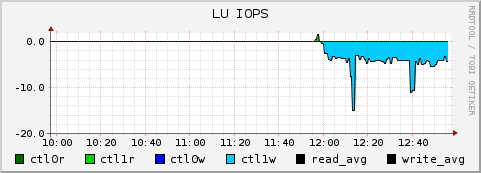
That’s ~200 IOPS, down to ~4 IOPS, a 50-fold amplification of write operations. Couple that with the extra I/O caused by RAID6 writes, and the underlying Tier-3 SATA disks were being worked extremely hard.
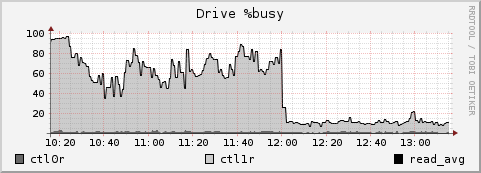
Unsurprisingly, the performance of this filesystem (and the others that share this Raid Group) has increased significantly.
Yes, a bit of hackery with SNM tools and some RRDTOOL by one of our previous colleagues 🙂
What did you use to graph your data? Did you just use rrdtool or did you have it pulled into nagios?