
Visualisation is a constitutive and essential part of the scientific activity. From basic research to the production of evidences (Amann and Knorr Cetina 1988), from the development of scientific theories to the stage of public evaluation, several methods of representation are the root from which the scientific discourse unfolds (Pauwels 2006, p.vii; Lynch 1988, p.153). Molecular pathways’ diagrams are a unique mixture of different forms of representation. They involve drawings, graphs, and diagrams, showing a dynamic process rather than a static and lasting entity. This essay will show that visualisation, interpretation and representation of scientific data is an active and knowledge-based process driven by pre-existing theories. Molecular pathways representations can be considered an effective way through which scientists display their interpretations, expectations and beliefs on molecular processes particularly difficult to visualise (Amann and Knorr Cetina 1988, p.86). Two diagrams representing a specific pathway will be analysed and compared to another type biological representation. Furthermore, it will be shown how the representations choices used for these diagrams reflect the audience of scientific experts they address. Finally, divergent points of view on to what extent theory-based and theory-driven observations can be considered reliable scientific facts will be presented. Using texts by Lynch, Hacking and other authors, molecular pathways representation will be debated as a particularly effective example demonstrating that empirical observations and theoretical knowledge are the two complementary and inseparable side of scientific investigation. Through the guide of scientific knowledge, these representations do not aim to crystallise theories, but to provide opportunities for scientific discussions and further investigations.
A constitutive feature of scientific activity is the production of visual representations of objects of study, processes and theories. Scientific publications always include images and illustrations that are irreplaceable documents enabling to perceive and analyse the object of study (Lynch 1985, p.195). In science, visualisation is performed using diverse techniques such as photographs, graphs, diagrams, maps, drawings, documents produced during laboratory research and illustrations included in published papers (Lynch 1998, p.27). Among these numerous forms of scientific visualisation, diagrams of molecular pathways constitute a unique and particularly interesting example. As the American NHGRI’s (National Human Genome Research Institute) website defines it, a biological pathway represents a series of actions and interactions among molecules (such as proteins, nucleic acids, simple molecules, chemical compounds and so on) taking place inside a cell and leading to a certain resulting change or effect in the cell itself (NIH National Human Genome Research Institute 2016). Typical “effects or changes” that molecular pathways trigger are inflammatory responses, assembly of new molecules, change in the DNA expression profile of a cell by turning specific genes on and off and myriad of other processes.
The processes necessary for visualising the components of these interactions, interpreting the data and effectively visualise these complex and dynamic networks would not be possible without a specific scientific knowledge. Moreover, some expectations and theories guiding research and interpretation are always necessary. As will be shown further in the text, molecular pathways can be considered representation of scientific theories rather than visualisation of “objects of science”. Considering these “visual dynamic theories” as trustworthy, therefore, involves relying on instrument of science investigations (Woolgar 1988, pp.31-33).
Visualisation in science involves several practices “associated with making objects observable and intelligible” (Lynch 1998, p.27). Observing is the fundamental activity that enables scientists to interpret the biological world, yet the human eye’s resolution limit varies between 0.1-0.3mm. Hence, in order to pursue studies in the biology field, it is necessary to use instruments such as the microscope enabling to see what is invisible (Bastide 1990, p.189). Microscopes and other visualisation techniques used in science allow scientists to closely observe the object of study and, thus, to accurately represent it and communicate it to other minds (Pyle 2000, p.69). Since the observational experience of biological specimens is possible only through the use of artificial organs, it will always be inevitably mediated by these instruments (Chalmers 1982, p.23). Furthermore, optical microscopies cannot be used when observing structures as small as molecules, viruses or cell’s organelles, all constituting element of biological pathways. In these cases, it is necessary to use more sophisticated techniques such as electronic microscopy, or photographic developing procedures like the Western blotting, used for visualising proteins’ presence and amount. Nevertheless, it is not the object itself what these instruments make observable, but its “trace” (Bastide 1990, p.189). A specialised knowledge is then necessary not only for using the instrument, but also – and especially – for interpreting the signal generated by this instrument, distinguishing and isolating it from the background and other signals (Hacking 1981, p.308). Every act of looking is, therefore, in itself an act of active interpretation that would not be possible without a prior knowledge enabling to use an “artificial organ” such as the microscope (Kemp 2000, pp.42-43). Microscopes – and other instruments – are an extension of individual sense organs through which the skilled scientist can see or feel what the instrument discloses (Polanyi 1967 quoted in Lynch 1998, p.28).
The study of biological structures is, therefore, possible only through the use of highly sophisticated observational instruments that, however, enable scientists just to observe the trace of the object of study that, subsequently, need to be interpreted. Can we, thus, consider the use of these instruments as an act of seeing (Amann and Knorr Cetina 1988, p.86)? Do microscopes provide scientific realism about what could not be observed otherwise (Hacking 1981, p.305)? Microscopes and other instruments don’t allow for a direct interaction with reality, but just a projection of it (Bloor 1976, p.40). Through this process, the focus is moved to the “externalised retina”, that is the graphic field on which the “trace” is displayed (Lynch 1988, p.154). Hacking (1981) defends the act of observation through a microscope by claiming that its reliability lies on what the very act of observing is. Observation is not a passive experience, but an active procedure; a skill that is learned “by doing, not just by looking”. Scientists need to be trained and educated to interpret the partial image that they see, distinguish artefacts form real objects (Hacking 1981, p.310). To see means to recognise and linguistically identify an object, a process in which sense data emerging from an experiment or observation are translated into more solid evidences (Amann and Knorr Cetina 1988, p.85-88). Observation is, and must be, guided by the scientist’s skills, experience and expectations, (Bloor 1976; Chalmers 1982, p.23) in which his or her perception works as a filter that selects, simplifies and translates a chaotic world into perceiver’s projects and interests (Lynch 1988, p.155-156). Biological pathways fit perfectly in this theory of observation. Investigation on these events is guided by scientists’ theories, skills and ideas (Bloor 1976, p.25) and their representation is the final result of a process of translating data into evidences; evidences enabling a theory about a complex molecular network to be meticulously investigated.
Studying molecular hypothetical interaction networks is a complex, long and theory-based process of interpreting data, scientifically verify interactions between molecules, translate these connections into solid evidences and represent the subsequent final improved theory in the most effective way. But when studying pathways, what actually are the observable biological objects of study? The biological elements interacting in molecular pathways made visible thanks to scientific instruments are, using Lynch and Woolgar, not natural objects, but “proximal things”: “residues impressed on graphic matrices”, ordered and filtered samples, photographic traces and chart recordings; in other words, “resemblance or symbolisations of external objects” (1990, p.5). These data act as the basis for subsequent interpretations and discussions (Amann and Knorr Cetina 1988, p.90-93). Conventions, then, allow for making the object of study visible and analysable by fitting the raw visual data into the disciplinary organisation of scientific theories (Lynch 1998, p.196). Through this process, an observation, driven and filtered by a pre-existing theory, allows a new visualisation and representation of a biological object of study. What could, thus, be a final representation of a biological object?
Just as visualisation in science research is an active process transforming specimen materials into analysable data (Lynch 1985 p. 195), the final representation of scientific findings and theories is not just a simple replication of reality. Visualisation of scientific knowledge aims to reveal reality, to make it more understandable and accessible. Visual representation in science does not seek to be a replica of nature, but to resolve a problem, fill gaps in knowledge, or facilitate knowledge building and communication (Pauwels 2006, p.viii). Indeed, what scientists know about their object of study and what they want to communicate about it is expressed in the way they represent it (Lynch 1998, p.32; Trumbo 1999, p.270). The image in figure 1 represent this very effort.
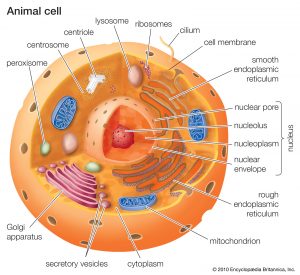
Figure 1. Schematic representation of an animal cell. Encyclopaedia Britannica, 2010. kids.britannica.com
Figure 1 shows the representation of a mammal cell from the children section of Encyclopaedia Britannica (Encyclopaedia Britannica Kids, 2010). The cell depicted in this diagram is not a real one, from a specific tissue with specific features, but the ideal cell, partially sectioned in order to show every basic feature that composes mammal cells. The white, neutral background helps to focus the attention on the image (Bastide 1990, p.200-203), while the use of several bright and unnatural colours and oversized inner structures makes it easier to identify the organelles in the different cell’s regions (Amann and Knorr Cetina 1988, p.112). Finally, thin lines connect the details to their linguistic identifications that surround and frame the image. What we see is not realistic, but an idealisation of an existing object that can be indirectly observed and visualised through the use of specific instruments. It represents a movement from the particularity of one observation to the generality of a scientific claim (Myers 1988, p.235-240). While in this image the process enabling these biological structures to be visualised is hidden (Lynch 1998, p.28), the knowledge that it represents is effectively concretised and communicated (Cambrosio et al 2005, p.187; Kemp 2000, p.120).
Pathways diagrams are created using these same visualisation concepts and guidelines. Nevertheless, pathways representation lies on a profoundly different level of complexity and abstraction. While the image in figure 1 is the idealisation of a lasting and observable biological structure, molecular pathways are phenomena, dynamic events in which the interaction between the participants begins, evolves and terminates during a finite period of time. Scientists can only observe the traces of these actions, by distinguishing and comparing data obtained before and after a process have taken place. These visualisations, then, must include the time dimension in order to explain processes that can be – only indirectly – observed in highly sophisticated ways. Graphs are the most used form of visualisation for such purposes since they can support more dimensions while remaining readable (Bastide 1990, p.206, pp.213-220).
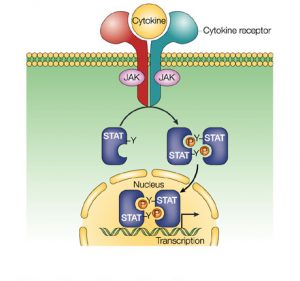
Figure 2: A schematic representation of the JAK-STAT pathway in the activated state (particular). Shuai and Liu 2003, p.901
The image in figure 2 is a representation diagram of the JAK-STAT molecular pathway taken from a review article published on the scientific journal Nature Reviews (Shuai and Liu 2003, p.901). The graphic design is, to a certain extent, similar to the one used for the animal cell in figure 1, whereas the differences between these two images help to highlight the key features of pathways representation. First of all, it is clearly noticeable that the target audience of these two images is completely different. While the cell image was included in an educational publication for children, the image in figure 2 comes from a scientific journal targeting an audience of scientific experts (Lynch 1988, pp.153-154). This difference is further underlined by the fact that while the cell image provides taxonomical annotations, the pathway diagram is completely indecipherable without a specific background knowledge. Both the images need to be contextualised by being integrated in a further explaining text (Bastide 1990, p.193-197); yet they are conceived in order to be identified and understood at a first glance by the audience they are targeting (Myers 1988, p.247).
Focusing on the pathway diagram, several elements worth being highlighted. The horizontal structure made of dots is a schematic representation of the cell membrane’s double layer dividing the extracellular space (white background) from the cytoplasm (green background); the nucleus is yellow and its membrane shows interruptions suggesting that the proteins involved in the pathway are able to pass through it. Indeed, the proteins constitute the core of the image and of the pathway as well. In order to highlight the concept over the representational accuracy (Myers 1988, p.240), proteins are represented as simple geometrical, two-dimensional and out of proportion objects with peculiar colours and shapes distinguishing them (Lynch 1988, p.168). They are also tagged with an acronym that stands for the complete name (e.g. JAK: Janus Kinase; STAT: Signal transducer and activator of transcription) (Amann and Knorr Cetina 1988, p.114). The key aspect of time, peculiar point of these diagrams, is represented using arrows and the vertical orientation of the image that must be read from top to bottom as a cascade of events (Myers 1988, p.247-249). An arrow connects a protein in its initial state (STAT on the left) to the same protein in a modified form (on the right), where an amino acid Tyrosine (Y) is modified (“phosporylated”) by the addition of a little P that stays for a phosphate groups. This transformation is triggered by the cytokine receptor, coupled with the cytokine (a small molecule working as a inter-cellular signal) and JAK proteins. Another arrow shows the movement of two modified STATs going inside the nucleus and triggering the final result of the entire pathway: a modification in DNA transcription (Bastide 1990, p.219-220).
Clearly, this is not an accurate representation of natural objects, nor is an idealisation of something that can be isolated and observed as it was for the animal cell in figure 1 (Lynch 1998, p.30-31). Pathways are a deep mathematical, visual and symbolic reconstruction of a phenomenon’s organisation (Lynch and Woolgar 1990, p.6; Cambrosio et al 2005). Their representations must be addressed more as a translation of a verbal argument into a visual discourse that unfolds through symbols and connections, as it would be for logic studies in philosophy (Lynch 1998, p.30; Lynch 1988, pp.160-162; Allchin 1999, p.291). Thanks to the acquisition of arrows and other symbols, diagrams become narrative and dynamic describing processes that, just as a theory or a discourse, have a beginning and an end (Kress and Van Leeuwen 1996, pp.83-83). They are logical demonstration visualised through a process of “figuration” (Cambrosio et al 2005, p.189).
Since it has been show that pathways diagrams are articulated visualisations closer related to a form of visual discussion on a theory than to an object’s representation, this means that a single diagram can be improved or modified in order to show different or new aspects of the theory it visualises.
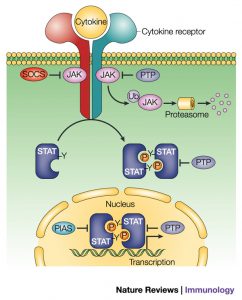
Figure 3: A schematic representation of the JAK-STAT pathway in the inhibited state. Shuai and Liu 2003, p.903
Figure 3 shows another image of the same JAK-STAT pathway taken from the same article (Shuai and Liu 2003, p.903). It can be seen that the main surrounding structures (cell membrane, cytokine receptor, nucleus) and the backgrounds are the same as in figure 2. This is an important aspect that makes us instantly understand that we are talking about the same topic and theory. However, instead of showing the pathway mechanism in its working state, it shows in what way this network is negatively regulated. New proteins are represented with new colours and a new organelle, the proteasome, is visible. There is also a new logic symbol that looks like a flipped “T”. This symbols derives from the modified Systems Biology Graphical Notation (mSBGN) and represents an inhibition influence on a target, in opposition to the arrow that represents stimulation or a transition from a state to another (SBGN.org). The addiction of this simple symbol enables the possibility of more articulated discourses and improves the visual representation.
It is now clear that the research on these molecular phenomena is embedded in and guided by pre-existing theories generated by scientists’ past experiences, knowledge and expectations (Chalmers 1982, p.25; Bloor 1976, p.30). This means that the same philosophical problems that sociologists and philosophers have raised for addressing scientific theories affect also the diagrams in which these theories are embodied. Chalmers firmly states that “theory of some kind must precede all observation statements and observations statements are as fallible as the theories they presuppose” (Chalmers 1982, p.28). Since observations are permeated by theory, it could be presumed that only those observations that can confirm and shed more light on a pre-existing theory are carried out, while those considered misleading are ignored (Chalmers 1982 pp.32-33; Bloor 1976, p.25). Even on the representation and publication stage, scientists can choose what to show and what to hide in order to reinforce their theories (Morus 2006, p.105).
Considering these aspects, can representations of dynamic invisible processes be reliable? The fact that representations deriving from scientific researches and observations, especially concerning complex and elusive phenomena as molecular interactions networks, are based on and driven by theories and expectations does not imply that these observations and findings are purely fictional (Amann and Knorr Cetina 1988, p.114). On the contrary, ideas and theories are needed in order to use scientific instruments, to interpret the data that they produce and to formulate and improve conception on what we see rather than just seeing it (Hacking 1981 315-316; Pyle 2000, p.69). The image, even though “fabricated”, is the way of “visually reproducing the sense of what was seen”, which is a longer process made of numerous observations, comparison and discussions involving several scientists. Through a process of “visual thinking”, production of scientific images is incorporated as a part of conscious thoughts, deciding what shapes, lines, colours and compositions to use for making them meaningful (Trumbo 1999, p.269). Visual evidences don’t work as a way to visually crystallise theories, but providing opportunities for discussions and further investigations (Amann and Knorr Cetina 1988, pp.114-115).
The study of biological molecular interactions would not be possible without the use of highly sophisticated instruments enabling scientists to visualise what is invisible and to extrapolate from the biological chaos a “docile object” (Lynch 1985, p.201). It has been shown in this essay that every aspect of the research on molecular pathways, from their observation and confirmation in the laboratory, to the graphical visualisation of the hypothetical process, needs a specific and advanced knowledge capable of interpreting and deciphering it. Pathways diagrams are a unique form of visual discourses representing scientists’ theories, ideas and expectations. They are as fallible as the theories they represent. Nonetheless, their presence in scientific articles is crucial in order to effectively communicate these theories and how they were conceived. Although “fabricated”, this mathematical representations and the scientific data they present are not fictional (Amann and Knorr Cetina 1988, p.114). Through the process of visual thinking, production of such scientific images is incorporated as a part of conscious thoughts helping the improvement of the scientific practice by sharing knowledge and triggering discussions, investigations and new researches.
Filippo Guizzetti (2016)
References:
- Allchin, Douglas. 1999. “Do We See through a Social Microscope? Credibility as a Vicarious Selector”. Philosophy of Science 66: S287-S298. University of Chicago Press. doi:10.1086/392732.
- Amann, K. & Knorr Cetina, K. 1988. “The fixation of (visual) evidence”. In Representation in scientific practice, pp.85-122. Lynch, Michael & Woolgar, Steve. 1990 Mass.: MIT Press.
- Bastide, François. 1990. “The iconography of scientific texts: principles of analysis”. In: Representation in scientific practice, pp.187-230. Lynch, Michael & Woolgar, Steve. 1990 Mass.: MIT Press
- Bloor, David. 1976. Knowledge and social imagery, pp.24-45. London: Routledge & K. Paul.
- Cambrosio, Alberto; Jacobi, Daniel & Keating, Peter. 2005. “Arguing with Images: Pauling’s Theory of Antibody Formation”. In Visual cultures of science, pp.153-194. Pauwels, Luc, Hanover, N.H.: Dartmouth College Press.
- Chalmers, A. F. 1982. What is this thing called science? pp.22-37 Indianapolis: Hackett Pub.
- Encyclopaedia Britannica Kids. 2010 “Eukaryote: animal cell”. kids.britannica.com. http://kids.britannica.com/elementary/art-112877/Cutaway-drawing-of-a-eukaryotic-cell.
- Hackin, Ian. 1981. “Do we see through a microscope?” Pacific Philosophical Quarterly 62:305-322.
- Kemp, Martin. 2000. The Nature book of art and science. Oxford: Oxford University Press.
- Kress, Gunther R & Van Leeuwen, Theo. 1996. Reading images, chapter 3 pp.79-113. London: Routledge.
- Lynch, Michael. 1998. “The production of scientific images. Vision and Re-vision in the History, Philosophy and Sociology of Science”. In Visual cultures of science, pp.26-40. Pauwels, Luc, Hanover, N.H.: Dartmouth College Press.
- Lynch, Michael. 1988. “The externalized retina: Selection and mathematization in the visual documentation of objects in the life sciences”. In Representation in scientific practice, pp.153-186. Lynch, Michael & Woolgar, Steve. 1990 Mass.: MIT Press.
- Lynch, Michael & Woolgar, Steve. 1990. Representation in scientific practice. Cambridge, Mass.: MIT Press.
- Morus, Iwan Rhys. 2006. “Seeing and Believing Science”. Isis 97 (1): 101-110. University of Chicago Press. doi:10.1086/501103.
- Myers, Greg. 1988. “Every picture tells a story: Illustrations in E.O. Wilson’s Sociobiology”. In: Representation in scientific practice, pp.231-266. Lynch, Michael & Woolgar, Steve. 1990 Mass.: MIT Press
- NIH National Human Genome Research Institute. 2016. “Biological Pathways Fact Sheet”. genome.gov. https://www.genome.gov/27530687.
- Pauwels, Luc. 2006. Visual cultures of science. Hanover, N.H.: Dartmouth College Press.
- Pyle, Cynthia M. 2000. “Art as science: scientific illustration, 1490–1670 in drawing, woodcut and copper plate”. Endeavour 24 (2): 69-75. Elsevier BV. doi:10.1016/s0160-9327(99)01262-4.
- Shuai, Ke & Liu, Bin. 2003. “Regulation of JAK–STAT signalling in the immune system”. Nat Rev Immunol 3 (11): 900-911. Nature Publishing Group. doi:10.1038/nri1226.
- Trumbo, Jean. 1999. “Visual Literacy and Science Communication”. In: Visual cultures of science, pp.266-284. Pauwels, Luc, Hanover, N.H.: Dartmouth College Press.
- Woolgar, Steve. 1988. “Representation and methodological horrors”. In Science, the very idea, pp.30-38. Chichester, Sussex: Ellis Horwood.
1 comment
Science and research are indispensable to the advancement of human society. By expanding our knowledge, driving innovation, improving health, protecting the environment, and informing public policy, science touches every aspect of our lives.
for more info:
https://aakscience.com/