In between our shorter updates we will also be posting some spotlight sections on the methods and equipment used throughout the project. Our first one focuses on the technical side of geophysical survey!
The magnetometer on standby
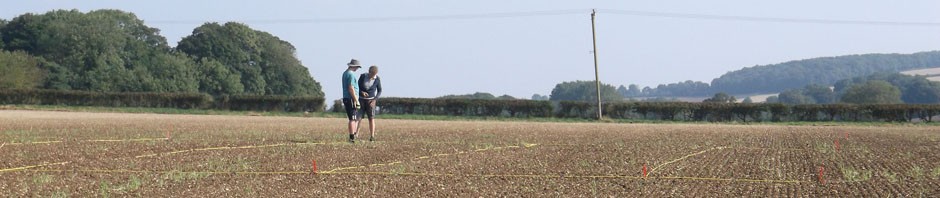
Magnetometry is part of non-intrusive surface surveying. The magnetometer itself (above) is the H-shaped device, as worn by Lloyd (below), which tests the magnetic fields above and below the surface. Magnetic fields differ between material types and natural materials in which human activity has occurred, such as burning or digging; as such, the differences logged by the magnetometer indicate evidence of activity rather than solid remains. On the one hand, it is light enough to transport as shown; on the other, the user cannot have any ferrous metals on their person while using it or they will interfere with the data collected. This includes anything in clothing and jewellery, no matter the scale – earrings, zips, shoelace eyelets, steel toe caps – so the technician in charge of magnetometry must always have a metal-free wardrobe for the day!
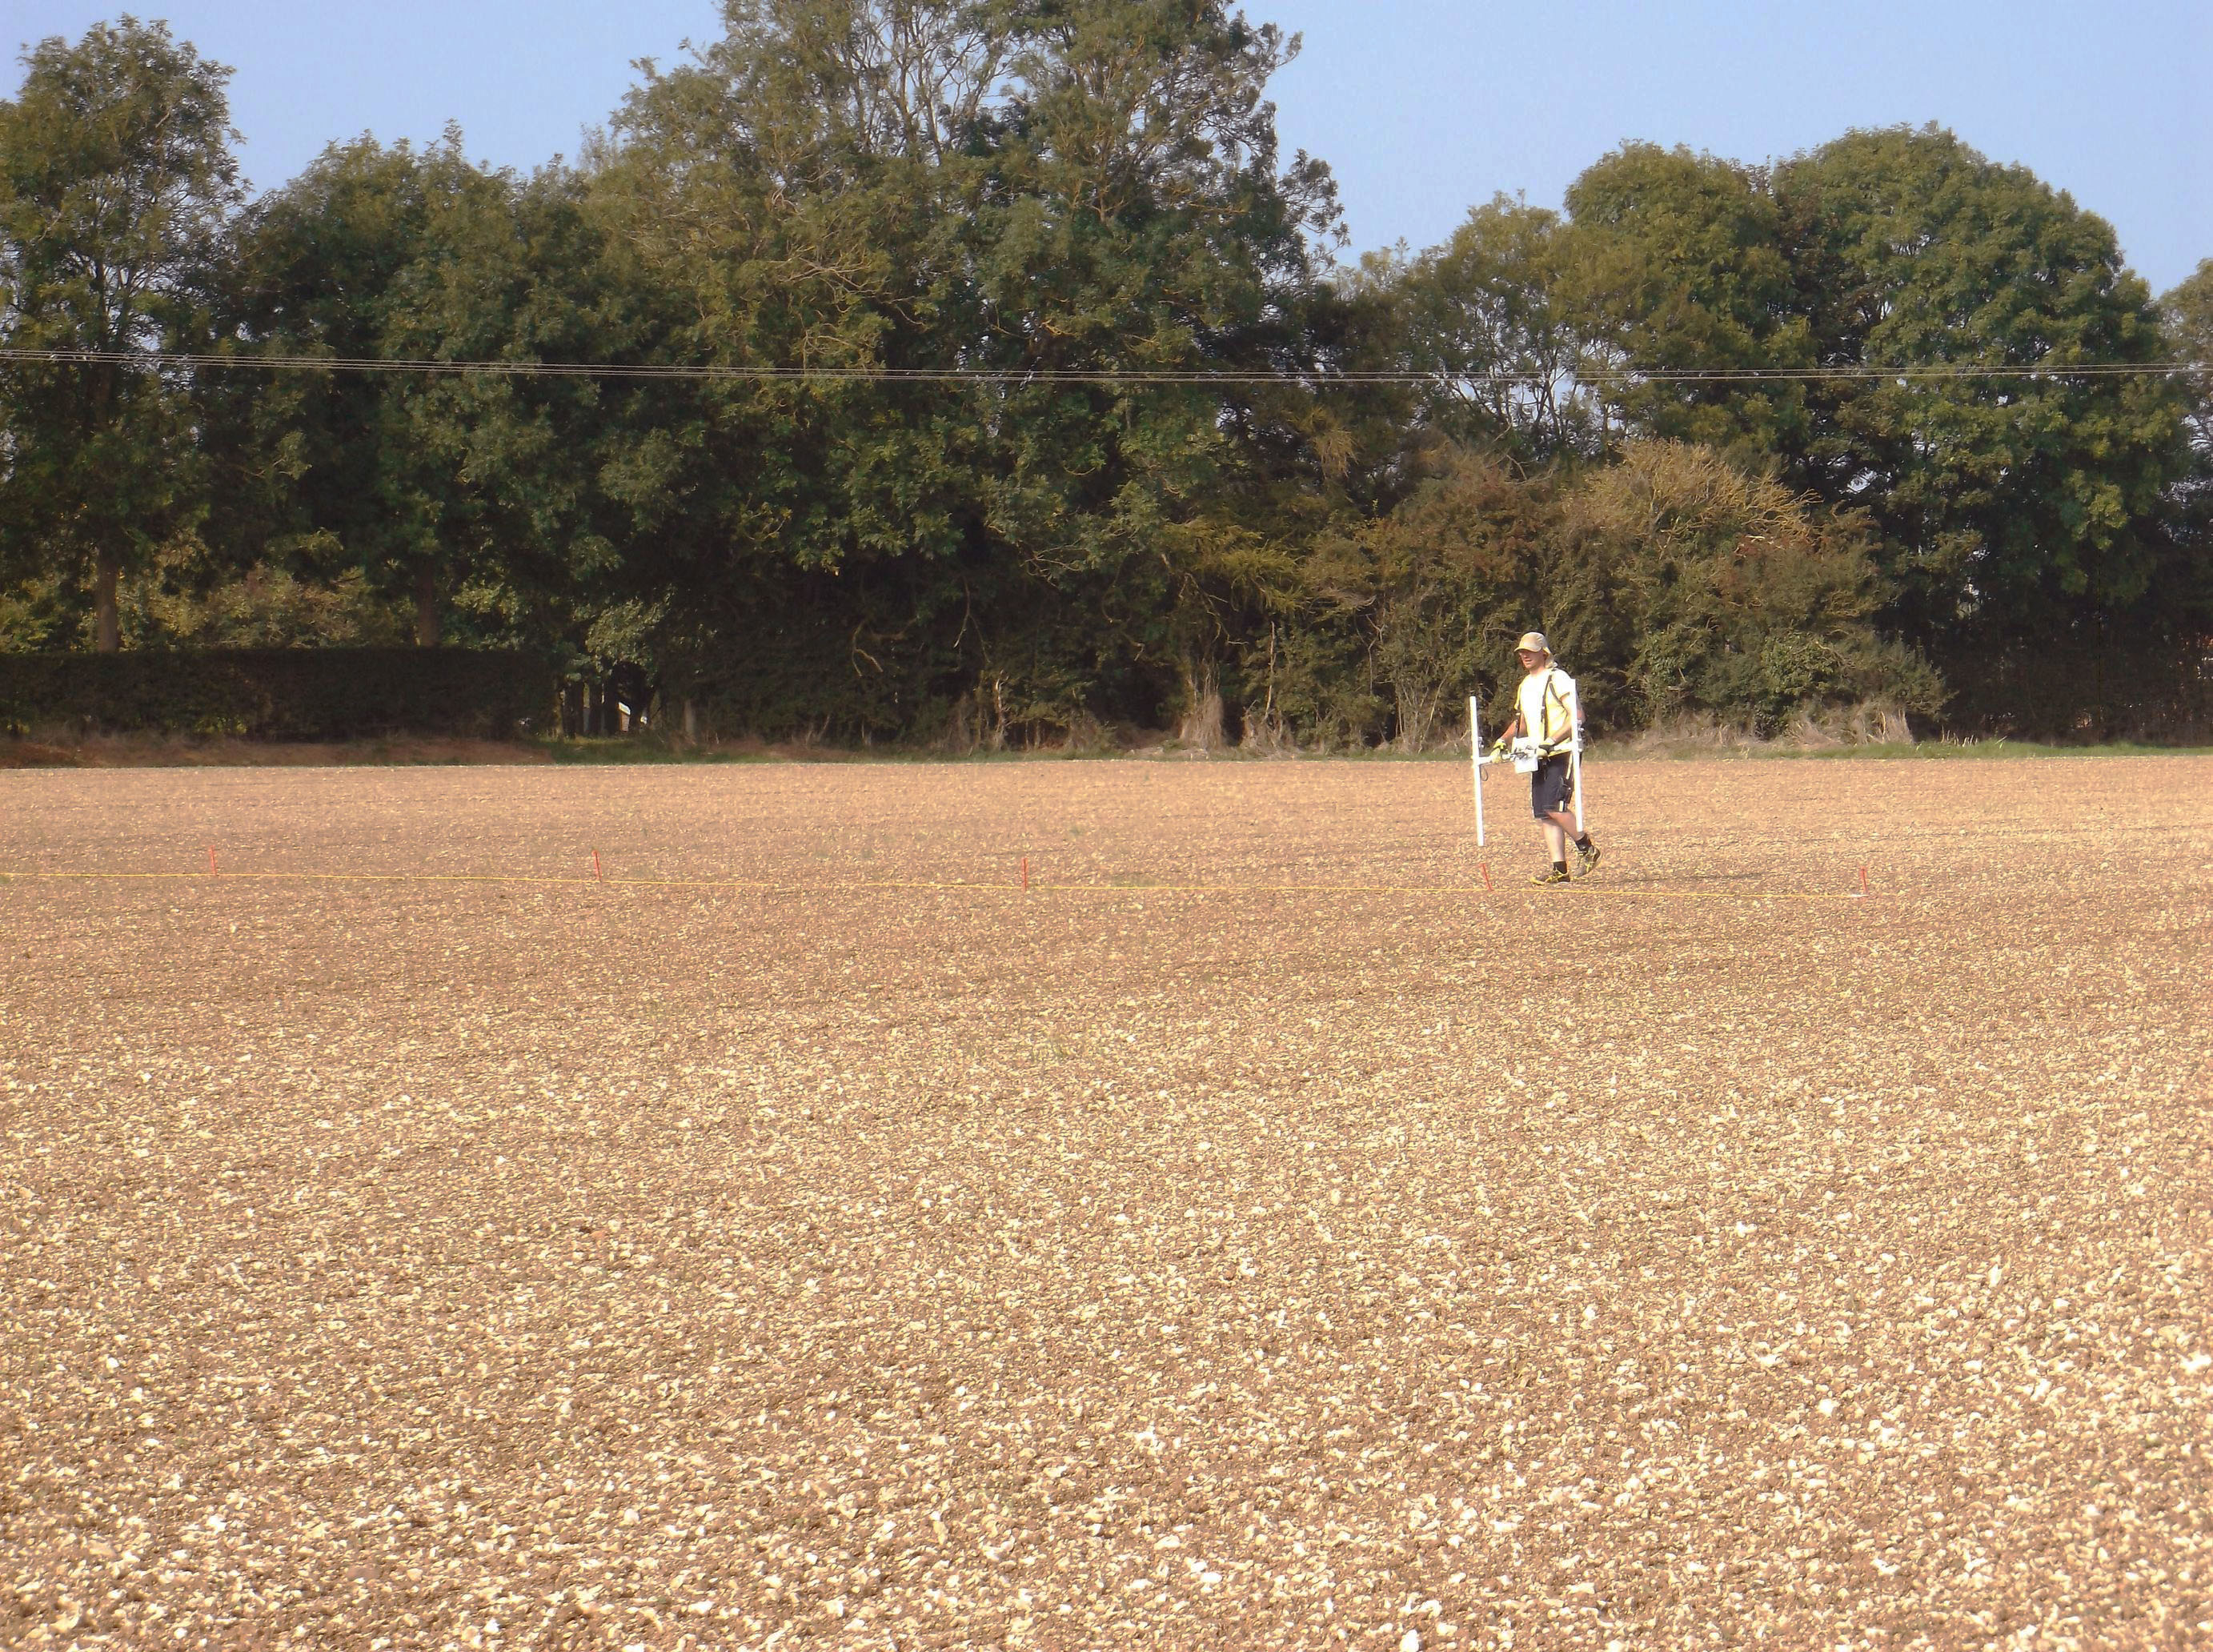
Lloyd taking the magnetometer out for a spin
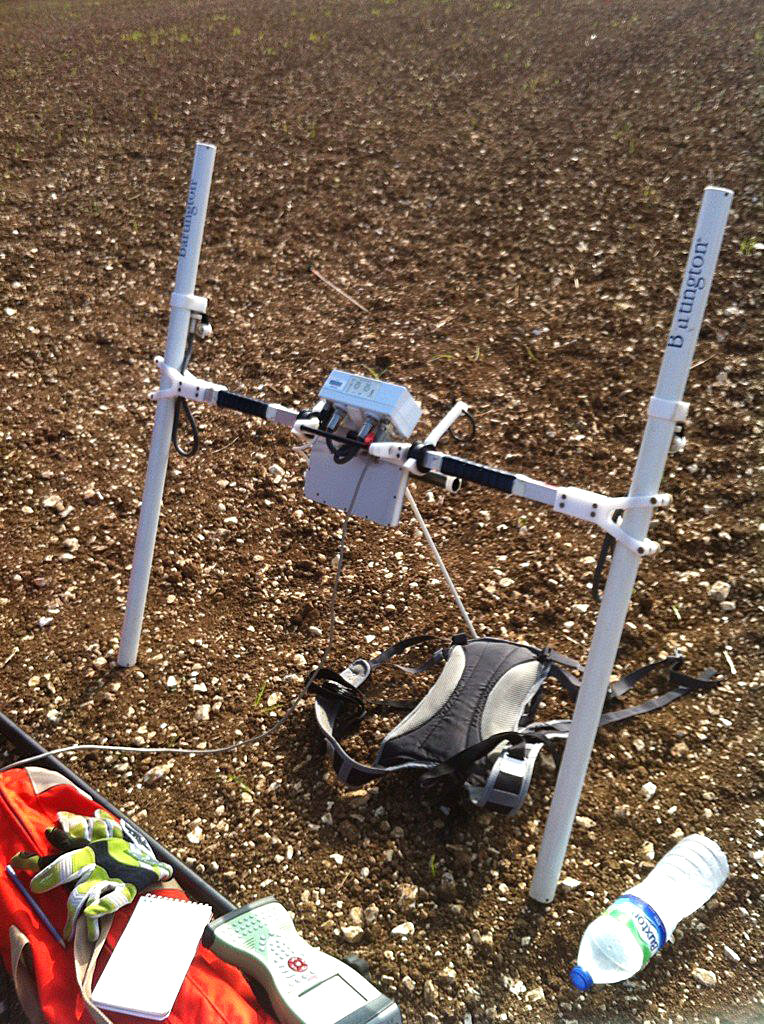
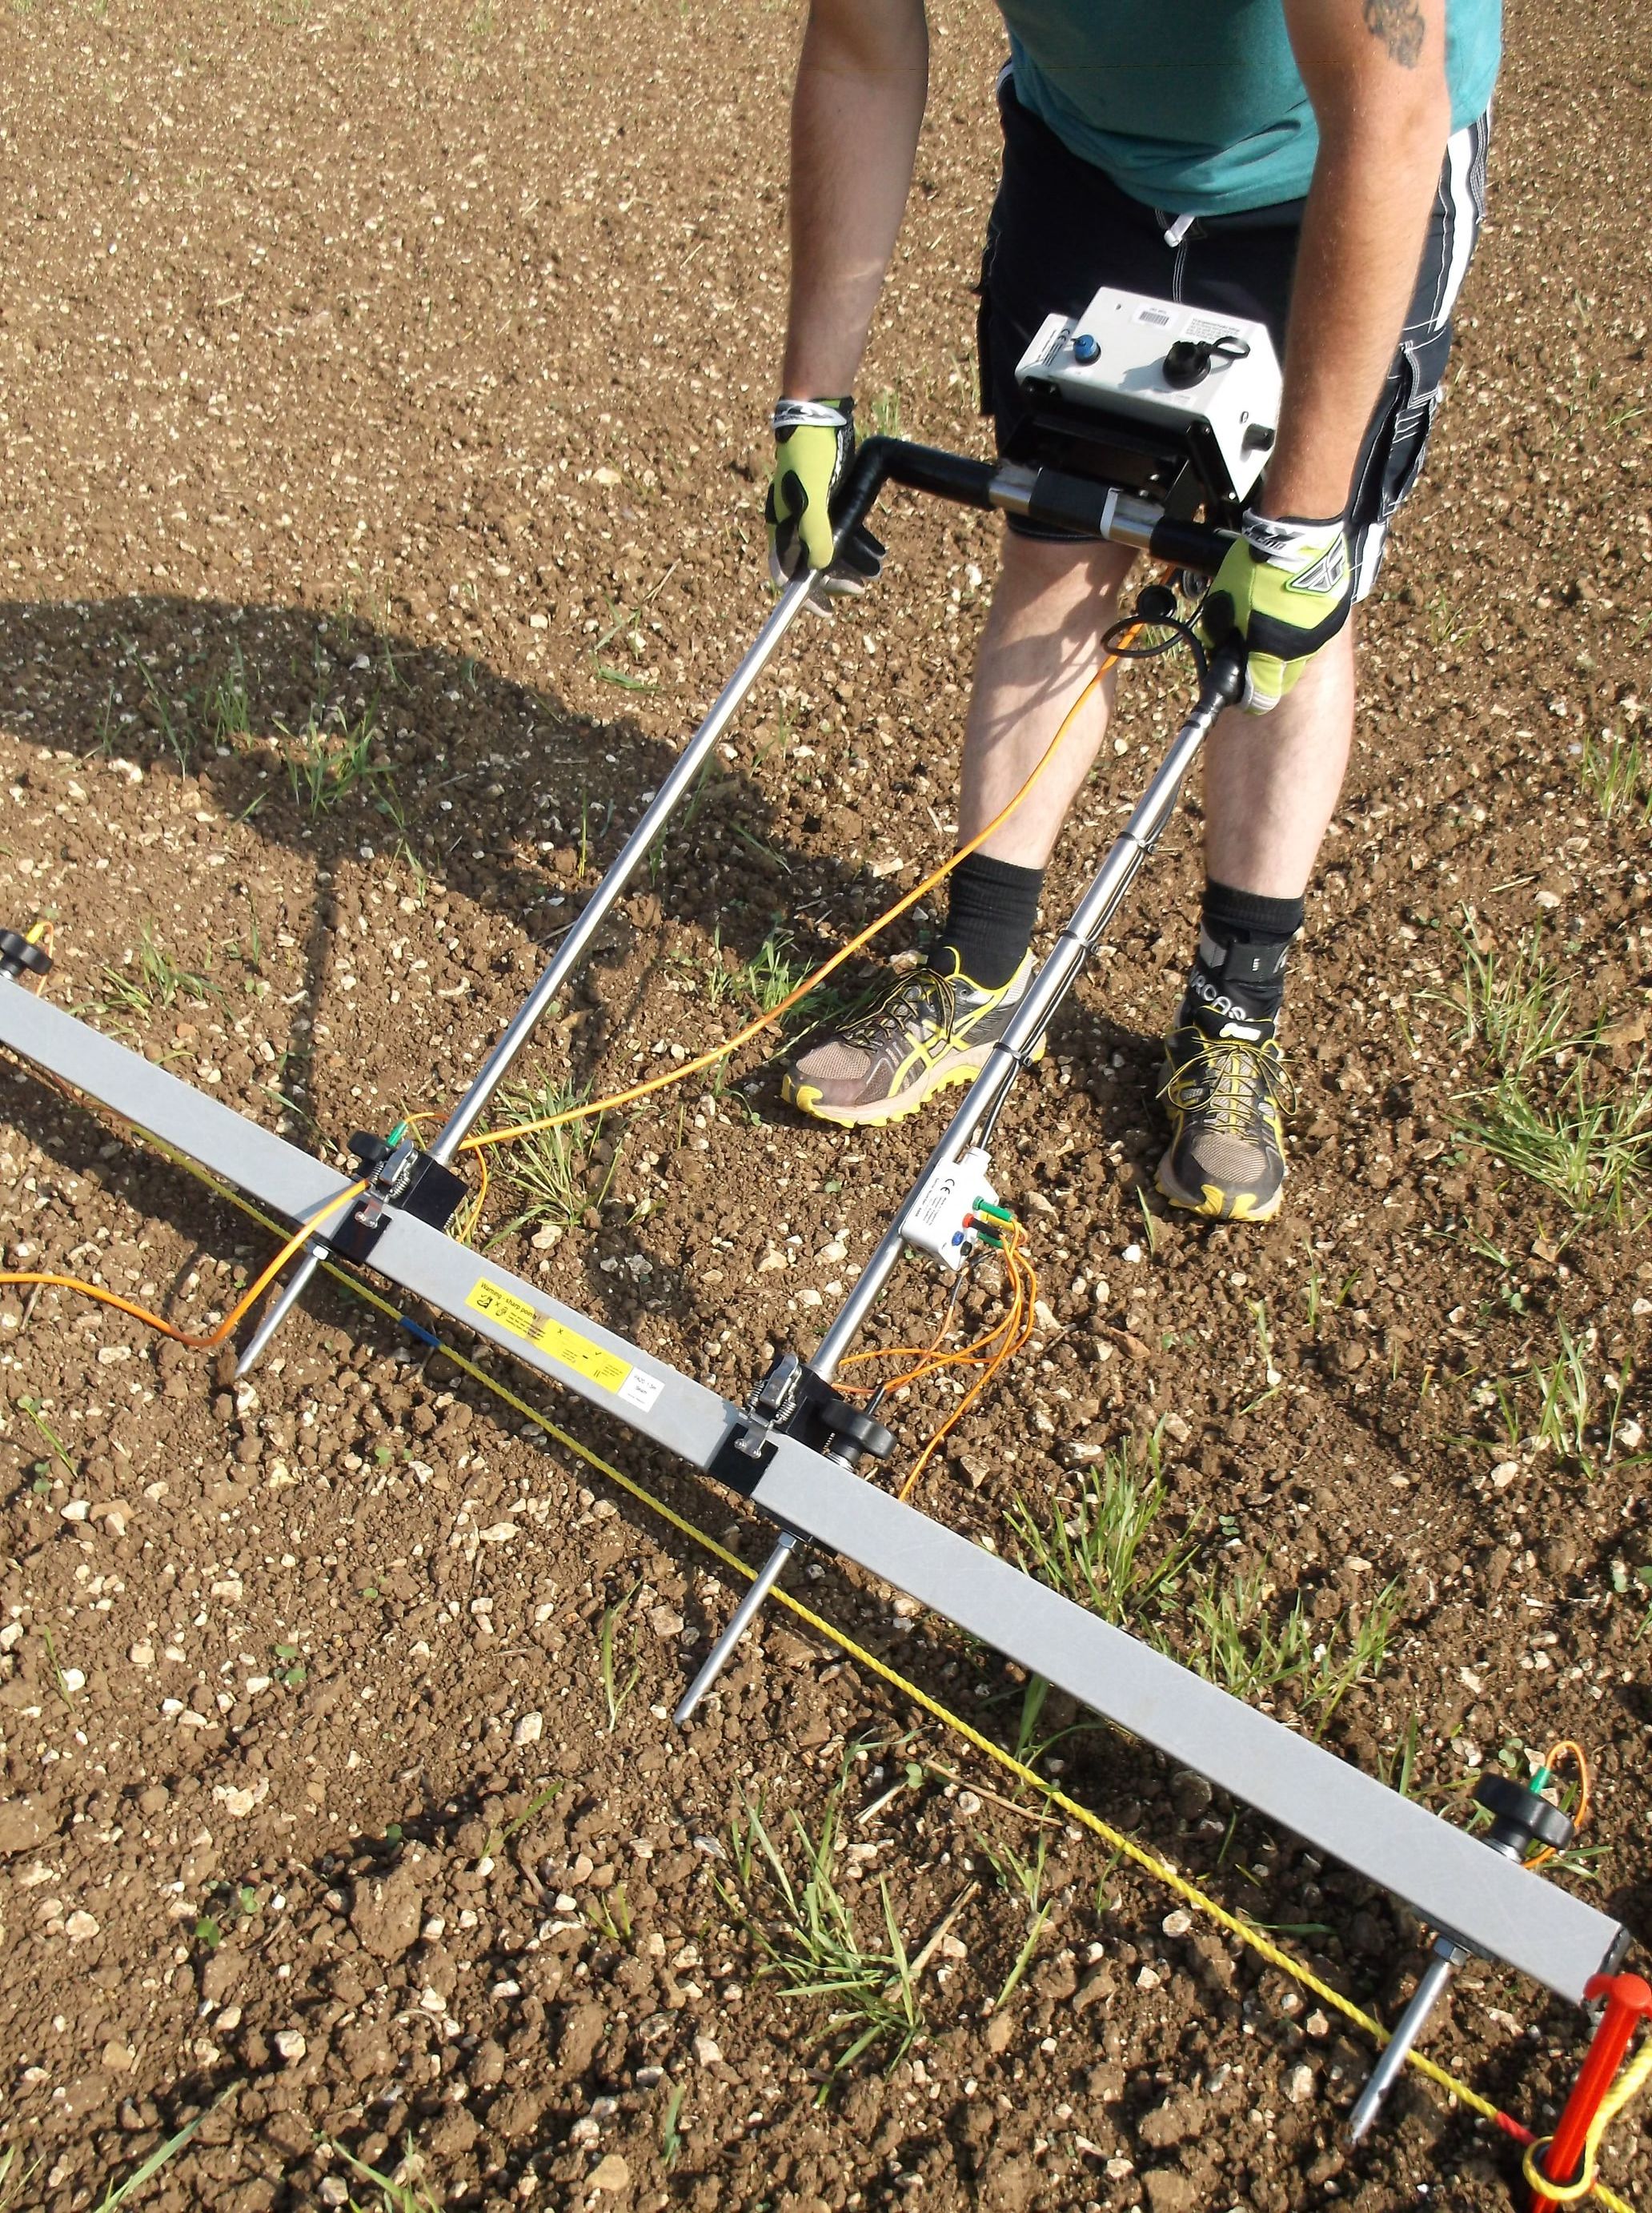
Resistivity is also part of surface geophysical surveying, and collects data based on the presence of physical features below the soil. Compared to magnetometry, resistivity is reliant on readings of the electrical resistance picked up by the resistivity meter’s sets of probes (below) – the meter itself is a frame complete with computer and two sets of spike-shaped probes which take individual readings.
The resistivity meter showing off its spike sensors
This state-of-the-art equipment represents a considerable investment in archaeological studies by the University, and today, both machines are programmed to take readings over a certain pattern or distance; ours, for example, are set up to correlate to a snake-like walking pattern in a square grid which is marked out on the ground with ropes and pegs. A great feature of these machines is that their data can be translated from the bare numbers to a map-like image using specialist software in a matter of minutes – from a visual standpoint, this is the simplest way of comparing the results of resistivity, magnetometry, and fieldwalking finds over an area map. This has allowed us to direct the course of our project more efficiently, as we can see very quickly which areas have more features for us to investigate!