Resolving a long running complex and intermittent issue provided a good opportunity for a blog post on the process involved and why some seemingly simple jobs can take a disproportionate amount of time. Hopefully it may also help anyone else seeing this issue.
The Issue
Over the last 18 months we have noticed an intermittent issue with copying large files between our Canterbury and Medway campuses. This has proven difficult to diagnose as it only happened intermittently between some machines, and because we don’t have many active servers at our Medway site. As a result we would end up doing a bit of investigation, then other jobs would take priority.
This week, that changed. I was working to update a part of the core Medway infrastructure (DNS/DHCP server), and had moved the VM from our Canterbury VMware cluster to the Medway one. This succeeded fine but once the machine had been moved it was frequently failing to check into puppet as shown on the chart below. Big chunks of red are bad news.
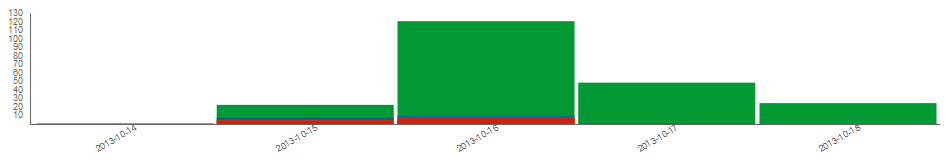
We routinely monitor machines that are failing to apply their puppet configuration, so this wasn’t something I could ignore.
The Process
Running the puppet agent manually a few times suggested this was the same issue we’ve seen before – the transfer starts ok, but after a little while simply stalls. Our previously used test of copying a large file of random data repeatedly until it dies seemed to confirm this.
bcc@canterbury:~$ dd if=/dev/urandom of=randomfile bs=1M count=1024
 1024+0 records in
 1024+0 records out
 1073741824 bytes (1.1 GB) copied, 152.436 s, 7.0 MB/s
bcc@canterbury:~$ scp randomfile bcc@medway:
bcc@medway's password:
randomfile 3% 40MB 6.7MB/s - stalled -
Previous testing seemed to have narrowed the issue down to copying large amounts data between Linux machines and both the puppet client and puppetmaster are running RHEL 6. I wanted to see what was going on, so I fired up tcpdump after the copy had stalled. The packets seemed to be leaving the Canterbury source OK, and I could see them arriving at the Medway target, so I started looking at the firewall configuration.
Our managed RedHat servers do have a fairly agressive firewall so it’s possible that something odd was happening. We had previously ruled out Path MTU discovery issues and a quick double check showed that both ends were permitting the relevant ICMP packets for that to be working ok, so I turned on logging for dropped packets. This confirmed that the firewall was dropping packets, but unexpectedly it was at the Canterbury end:
Oct 16 14:15:36 canterbury kernel: IN=eth0 OUT= MAC=00:50:56:33:01:1f:00:24:f7:3d:6c:00:08:00 SRC=129.12.me.d DST=129.12.ca.nt LEN=120 TOS=0x00 PREC=0x00 TTL=55 ID=4534 DF PROTO=TCP SPT=22 DPT=46744 WINDOW=1817 RES=0x00 ACK PSH URGP=0
Oct 16 14:15:36 canterbury kernel: IN=eth0 OUT= MAC=00:50:56:33:01:1f:00:24:f7:3d:6c:00:08:00 SRC=129.12.me.d DST=129.12.ca.nt LEN=80 TOS=0x00 PREC=0x00 TTL=55 ID=4535 DF PROTO=TCP SPT=22 DPT=46744 WINDOW=1817 RES=0x00 ACK URGP=0
These packets were being dropped as they didn’t pass the stateful firewall check of being NEW, ESTABLISHED or RELATED – they were rejected as INVALID, and temporarily bodging the firewall to permit INVALID packets made the problem go away.
The next step was to rule out any other common factors. Since the other DNS/DHCP server at Medway was going to be replaced with a physical server that had already been setup, it was an easy test to copy the file to that machine. The result was the same, so that immediately ruled out the VMware infrastructure at the Medway end. I wasn’t seriously expecting it to be VMware cluster at Canterbury due to the large number of active services there, but a test with another physical host ruled that out.
At this point it had to be either the iptables firewall going mad, or some network device between our Canterbury datacenter and our Medway datacenter.
I fired up tcpdump on both ends and kicked off another test copy, hoping to see both ends of the connection. This introduced more problems…
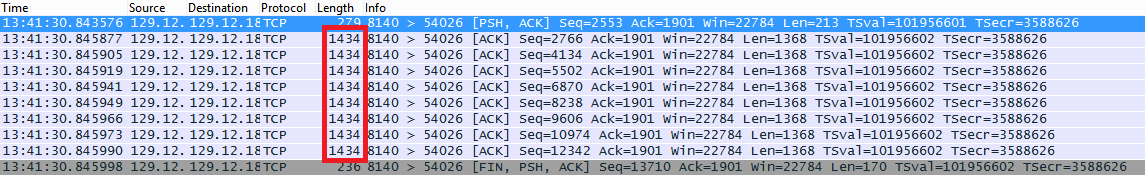
I loaded the tcpdump files into wireshark (a gui tool for examining network protocols), and noticed a number of missing packets. Finding the relevant segments in wireshark, it was clear that I wasn’t seeing the full picture thanks to TCP Offload.
In effect TCP Segmentation Offload allows the computer to hand large chunks of data to a modern network card very efficiently, and the network card has dedicated hardware to break that down into suitably small chunks for sending.
![]()
At the far end, we receive a number of smaller packets:
Normally this is desirable as it improves performance and reduces CPU load on the computer, but in this instance it made it harder to see what was going on. Wondering if TCP Offload implementation was part of the problem, I turned it (gso = generic segmentation offload, in this case) off.
# ethtool -K eth0 gso off
I could confirm with tcpdump that I was now seeing smaller segments leaving the Canterbury host, and that the same size segments were arriving at Medway, but unexpectedly this made the problem much worse. On the plus side connections now stalled much more quickly and much more reliably, which made testing much easier.
Capturing a new set of tcp dumps for a stalled connection, I was still seeing many missing segments, but I was also seeing ACK packets (acknowledgements) on the other side. This seemed unlikely as there was nothing in the firewall logs to suggest they were being dropped, and had they genuinely not arrived, the ACK wouldn’t have been sent. It turned out that tcpdump was struggling to keep up with a gigabit transfer with a ‘host=canterbury’ filter.
I should have noticed this, as tcpdump does tell you…
root@medway:/var/log# tcpdump -i eth0 -s 0 -w pies host 129.12.ca.nt
tcpdump: listening on eth0, link-type EN10MB (Ethernet), capture size 65535 bytes
187391 packets captured
192630 packets received by filter
5235 packets dropped by kernel
Argh. I didn’t want to disable the filter as the resulting files would have been huge, and in the end turning on compression of the file transfer slowed things down enough that no packets were lost in the next capture.
I was finally able to compare the captures side by side in wireshark with both hosts displaying the same size packets and without any unexplained missing segments.
Looking at the conversation between the two servers showed that everything was going fine until one packet (of ~1500 bytes) did genuinely go missing, at which point the TCP connection stalled while one server tried repeatedly to reply to the other, not knowing these packets were being blocked by the firewall. Fortunately tcpdump sits on the wire before the firewall so I can see the packets at both ends. Initially everything looked ok, but a careful examination revealed something unusual.
The first was that the TCP checkums were different. This is unsual, as a router or firewall would not normally interfere with TCP layer, and proved that something was interfering deliberately – a hardware error would result in an incorrect checksum.
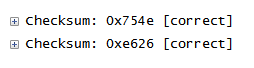
Wireshark also tries to make the sequence number of each segment ( essentially a counter so both ends can keep track) start from zero to make them friendlier, but in real life these start from a random number for security reasons. Both wiresharks were showing the same number, but looking at the actual data showed the numbers were different:
![]()
Again, this proves that something in the middle is interfering with the packets, but as long as it’s doing so consistently (and examination of the other successful segments suggested it was), there’s no reason this would cause problems. I was growing increasingly curious as to what this device might be at this point…
Finally, expanding the TCP options section further revealed the likely cause of the invalidity!
![]()
Here’s the original Wireshark views, showing these all together:
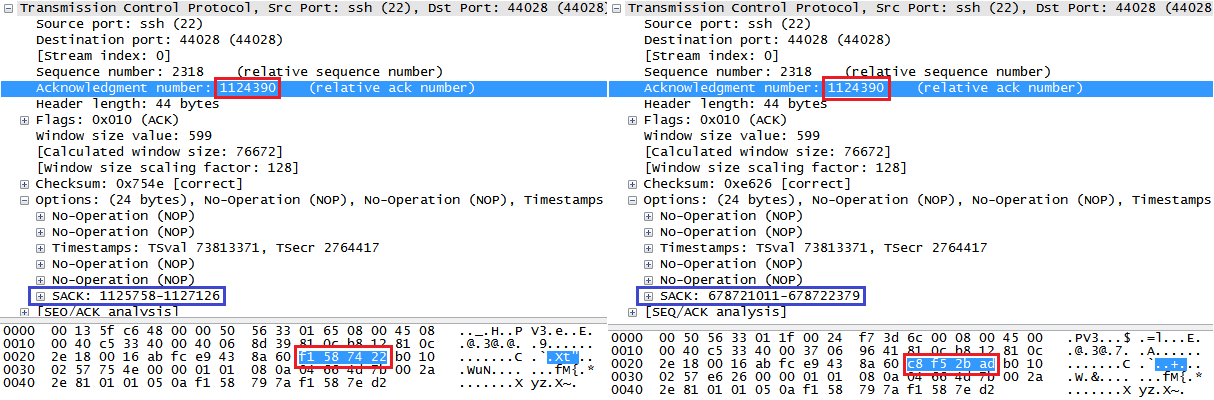
TCP SACK is an extension to TCP/IP (last updated in 1996, so it’s been around a while) that improves the efficiency of handling missing packets – it provides a way for a system to say “I received 1, 3, 4 and 5” meaning that only packet number 2 has to be resent. Without TCP SACK only packet 1 would be acknowledged, so 2, 3, 4 and 5 would all have to be resent. There’s a much more detailed explanation here.
It looks like there’s a firewall in the middle that’s doing additional TCP sequence randomisation which was a good thing, but has been fixed in all current operating systems. Unfortunately, it seems that firewall doesn’t understand TCP SACK, which when coupled with a small amount of packet loss and a stateful host firewall that blocks invalid packets results in TCP connections that stall randomly.
A little digging revealed that firewall to be the Cisco Firewall Services Module on our Canterbury network border. It turns out that sequence randomization is turned on by default on the FWSM, and as a default option doesn’t show up in the configuration. The good news is that Cisco do have an article about TCP SACK support on the FWSM, and recommend turning it off, which our network team are going to do in our next booking slot.
@myowan – yes, and it did 🙂
Hey, good description of this problem and your troubleshooting. We are having the same issue – stalled scp’s. I was wondering if your network guys had ever made the change and if that indeed did resolve your issue? Thanks, Mark (myowan@ithaca.edu)
Very interesting post, enjoyed reading your description of how you went about diagnosing the problem.