 The status of any situation cannot be best judged from an isolated point in time. It is also dangerous to judge one point in time versus another point in time (such as this year versus last year). Consider this in the case of a population of rare birds, or the status of your budget, or the number of volunteers in your organisation. The only meaningful understanding of a data point is where it sits in the context of the past, and ideally, the future. For example if we look at manatee boat-collision mortality (right) and we have an annual count of 50 manatee deaths, is that good., bad or indifferent?
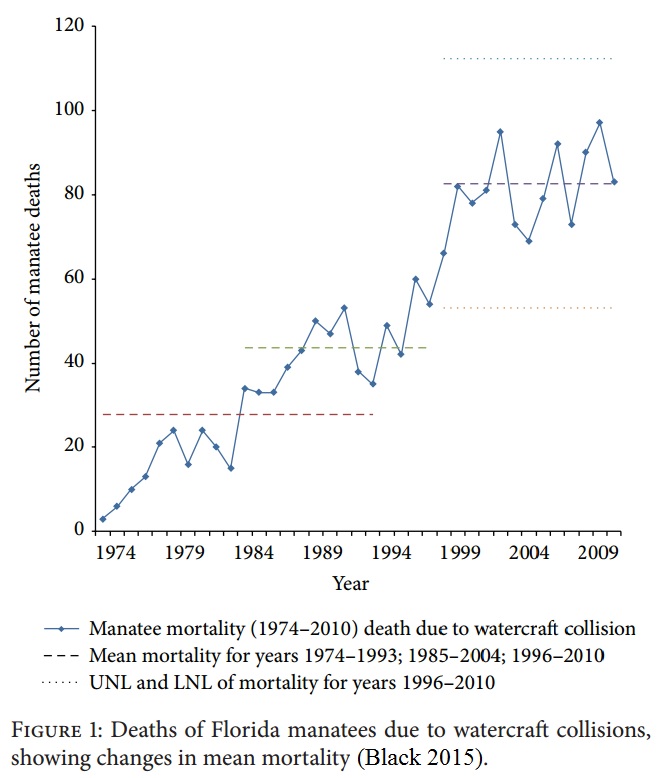
Prediction of the future is one of the most important but elusive skills that a manager can possess. Of course no one can actually predict the future, but we can identify predictable elements, or degrees of predictability. The best methods for prediction are based on using empirical data. In management circles, rather than establishing complex predictive models, the most pragmatic approach is to establish a picture of the current system and then base expectations on the predictability of the patterns of data in that system. For example with the Florida Manatee (above) we see three (or four) systems – a stable low level of collision deaths (to 1983), then a higher level from 1984-1997, then an unstable period 1997-1999, then a new system thereafter. You have to loo at the right system to understand what might happen next.
It is also unhelpful to define a level of performance as ‘good’ or ‘bad’. They key thing is how to stabilise it and how to make it better. The system in the 1990s is driven by the higher numbers of watercraft on the river systems – so collisions are more likely. We cannot say things are worse than in the 1970s, just that the likelihood of collision deaths is greater – and we might want to do something about that (such as impose slower waterway speed limits).
Reading:
Black S.A. (2015) System behaviour charts inform an understanding of biodiversity recovery. International Journal of Ecology, 2015 (787925): pp6 http://dx.doi.org/10.1155/2015/787925