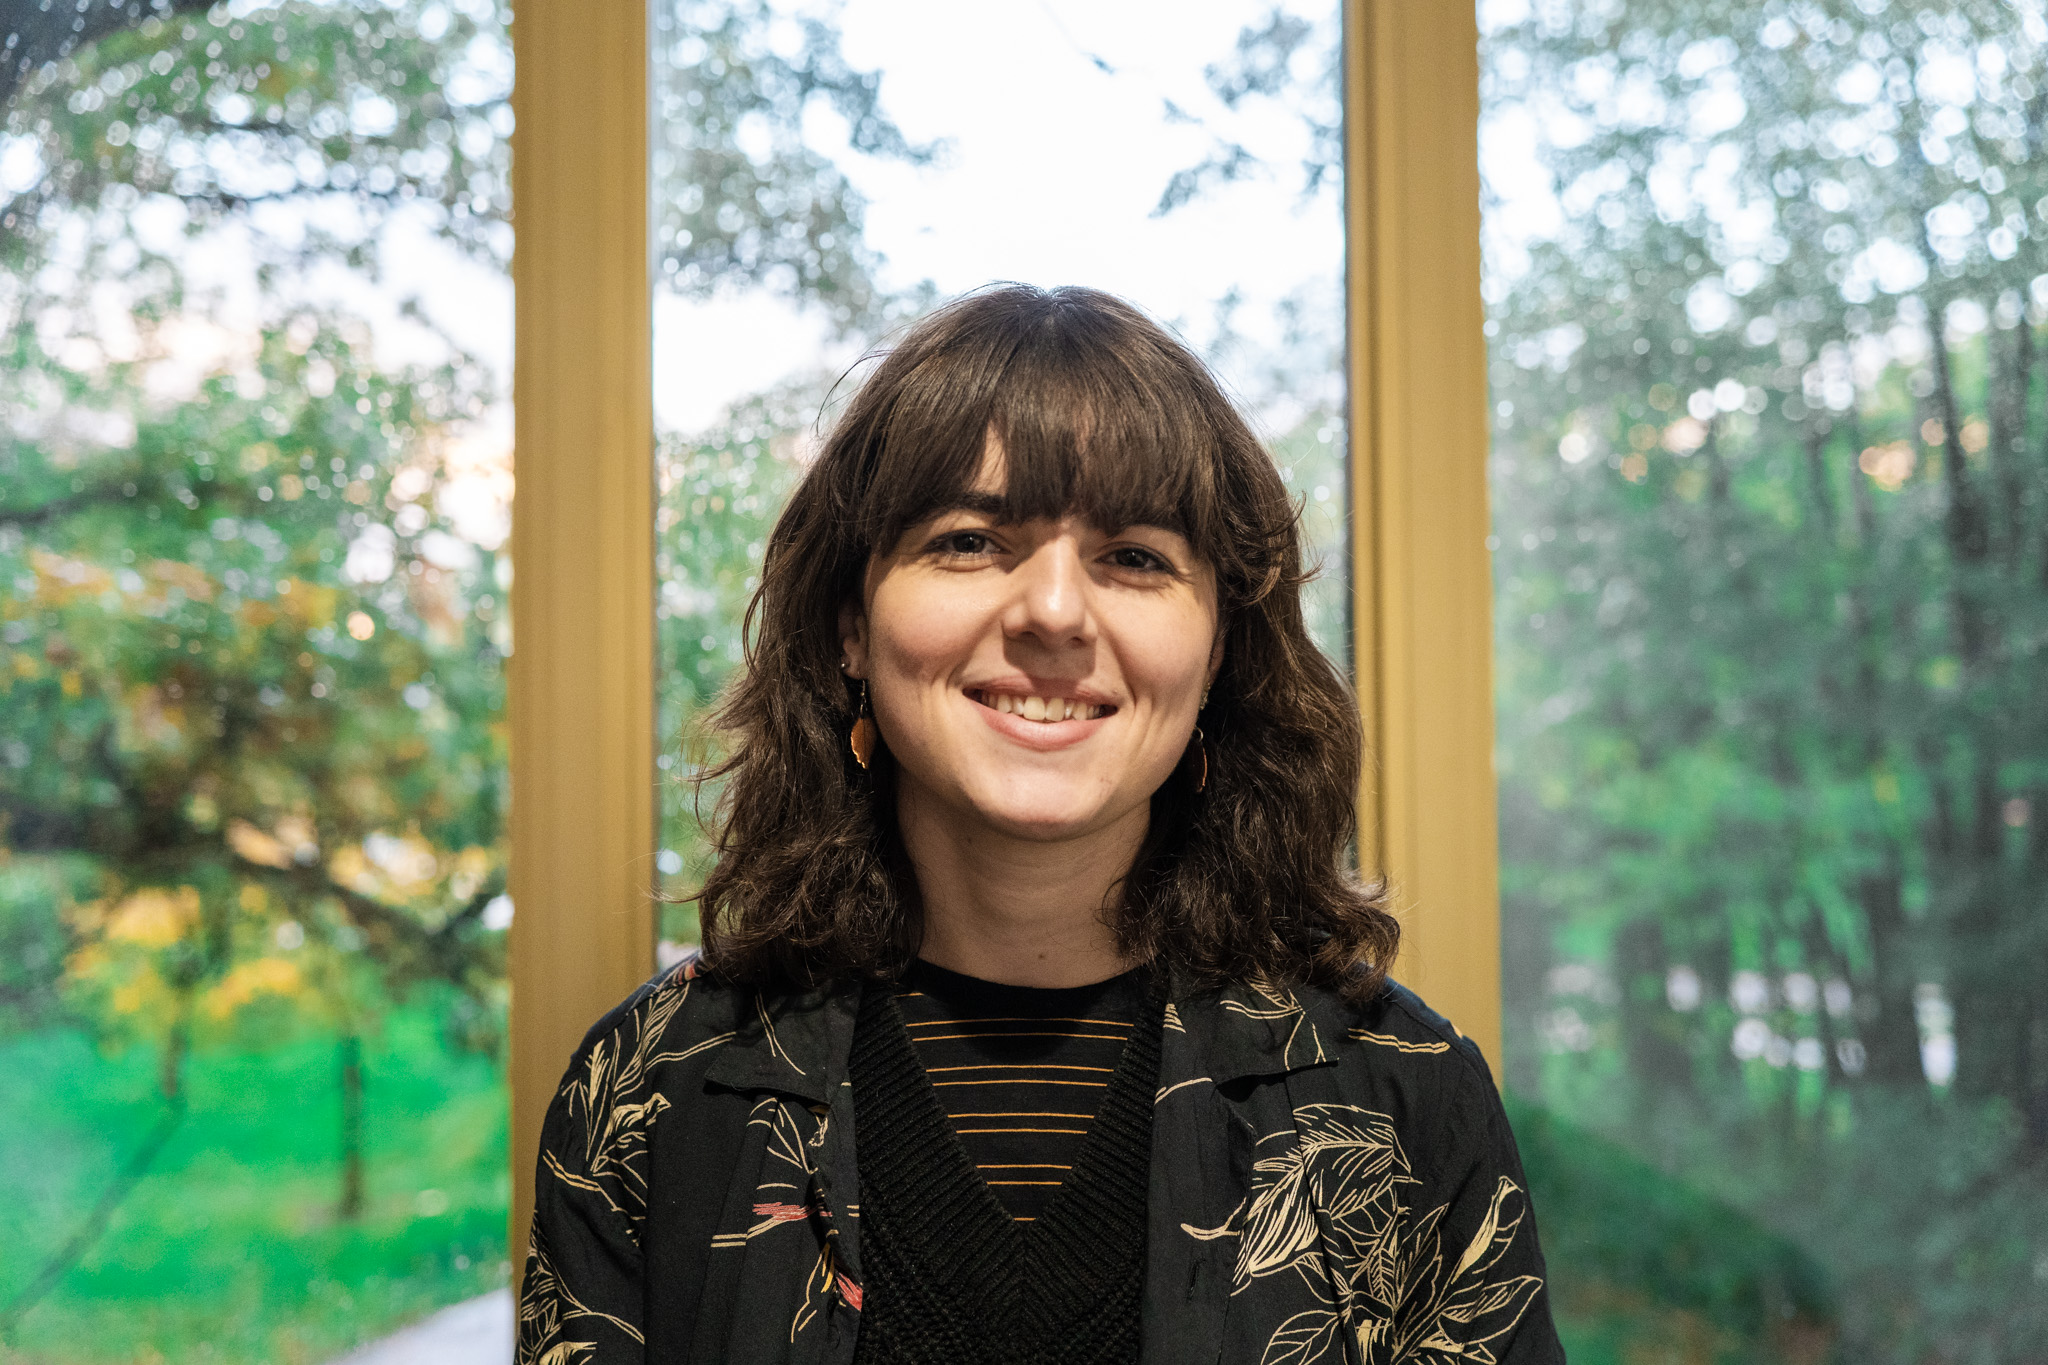
Studying a year in Data Analytics motivated Rebecca to complete a Data Analysis module and an SQL evening course this year. Now, Rebecca is aspiring towards an Environmental or Geographic Data Science Masters on completion of studies.
Why did you choose to study a year in Data Analytics?
I chose to study Environmental Social Science with a Year in Data Analytics because I wanted to diversify my skillset. As my core subject is a social science, I felt I was developing research skills: reading, summarising, analysing and evaluating sources, but had little chance to develop any tech, maths or stats skills.
How did you choose what to do?
I chose the Year in Data Analytics because it appealed to me the most. Maths was my favourite subject at A-Level, I wasn’t the best at it, but I enjoyed the process of solving problems, and my favourite module thus far at Kent had been a mapping one. I’d really enjoyed learning to use a new piece of software and creating maps in a form of presenting data. I thought the Year in Data Analytics suited my interests and aims!
What did you do during your year in Data Analytics?
Over the course of the year, I learnt how to code in R, which is a programming language for statistics, and through that carried out all kinds of statistical analysis and created graphics to display results. I learnt how to approach and understand datasets, starting from the basics of finding means and medians and by the end of the year creating predictive models and being able to work with huge datasets that had hundreds of thousands of observations. We also had modules focusing on research processes, from conducting questionnaires and interviews to doing extensive literature reviews. Additionally, there was a broad focus on how results and findings were presented and communicated, on how to make data accessible and understandable for as many people as possible.
What was your favourite project?
My favourite assignment of the year was when we each chose two MP’s and took their tweets from twitter before analysing them to see if we could discern patterns and trends in what they put out on social media. I chose Liz Truss and David Lammy who at that time were Secretary of State for Foreign, Commonwealth and Development Affairs and corresponding Shadow Secretary respectively. I hadn’t previously known so much analysis could be carried out on text, and it was interesting to discover how differently each chose to use their platform. This inspired me to go text-based for my end of year project in which I analysed the readability of different genres of fiction over time. It turns out Horror fiction is the most dense and tricky to read of the 5 most popular genres, scary stuff!
What about academic or study support?
Despite not feeling the most confident at the start of the year, it had been a long time since I’d done much maths or stats work, I always felt well supported and we were always encouraged to ask questions and talk to someone if we were struggling. A lot of sessions were held in PC rooms and so help was on hand as we were working through problems. We also did a good number of group projects in which we could learn together and support each other.
What skills have you developed for the workplace?
I feel I’ve developed skills in two ways. Firstly, in the easily identifiable way that I have learnt how to use R, how to create or obtain data and then take that jumble of data through cleaning, exploratory analysis, explanatory analysis, to final presentation and report writing. But it’s also helped me develop more general skills. I’ve become more organised and methodical in my working. It’s really improved my patience, problem-solving abilities, and innovative thinking. Writing a bit of code that then refused to run or gave back really strange results was an everyday occurrence and getting comfortable with the process of checking through it and tweaking it until you got it working was a necessity!
How has your degree helped your career prospects?
The Year in Data Analytics completely changed my career prospects. I didn’t know what I wanted to do before or what hard skills I had to offer. Now I know I want to work with data, and I feel I’ve started developing the skills and experience I need to do that. It motivated me to choose a Data Analysis for Conservation Biologists module this year to keep in practice and I’m taking an SQL evening course with Code First Girls, who provide free coding courses for women in order to promote higher female participation in the tech industry.
What do you want to do in the future?
After I finish at Kent this year, I’m looking at doing an Environmental or Geographic Data Science Masters. I want to merge my environmental knowledge from my core degree with what I learnt on my Year In, and then build from there.
What advice would you give to a prospective student considering taking a year in (industry, abroad, another subject)?
To anyone considering the Year in Data Analytics I would say do it. And if data analysis and statistics and coding are a million miles away from what you currently study don’t worry, you start off with the absolute basics and there’s so much support and help available along the way!
Rebecca Coston is in the fourth year of Environmental Social Science with a Year in Data Analytics.

