Visualising how services and systems interconnect can be very tricky to represent in a meaningful way. As part of our IS TechTalk series, I delivered a presentation (Kent IT Account required) entitled “What’s in the box?” as our use of FIM and other back-office identity management tools can be rather opaque and hard to understand.
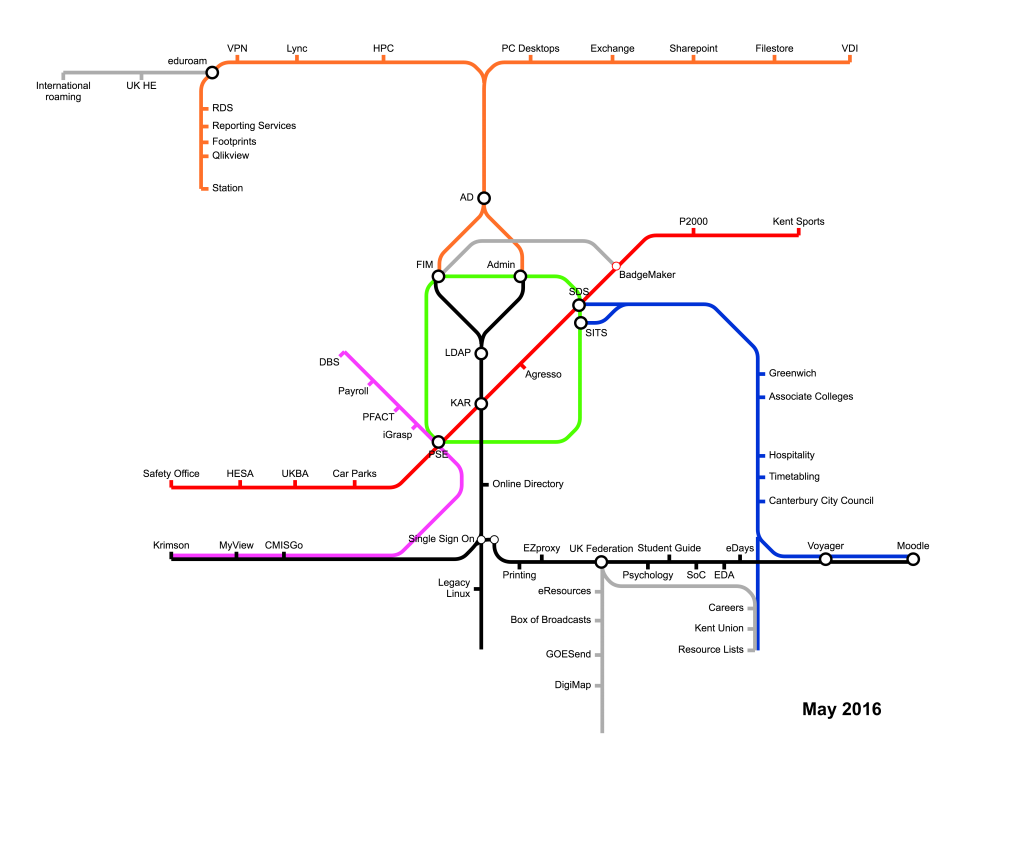
As part of this, I drew a systems map from an Identity Data perspective in the form of a Tube Map which I never got around to making available… until now! The lines represent independent ecosystems with the interchanges showing where data hops between these ecosystems. Any questions (I appreciate I didn’t supply a key!), please ask in the comments 🙂
