Introducing the Programme Plant

Following the technical sprint the project has been able to deliver a working  model of the Programmes administration application to the customer.

Overlaid screenshots of the Programmes Plant software
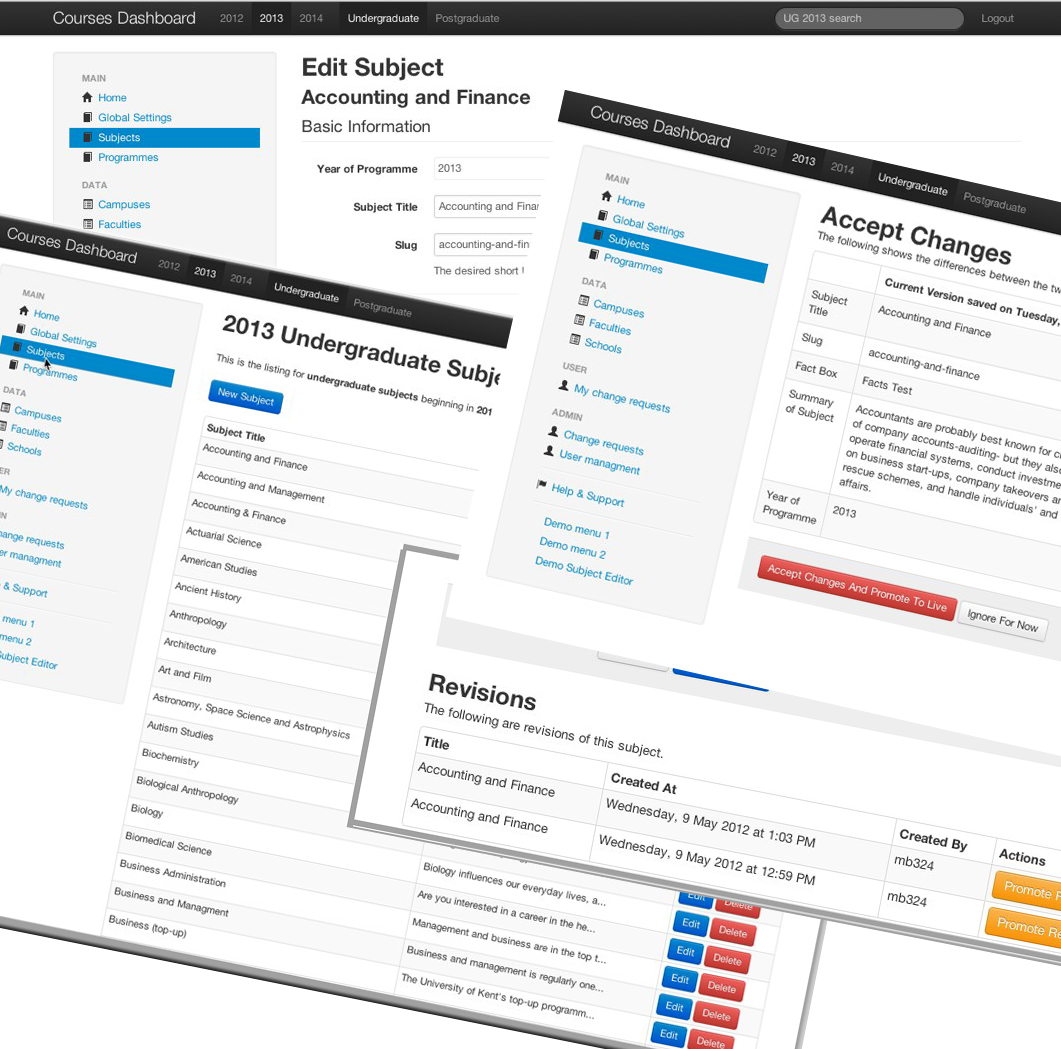
A great deal of work has gone into the project since its beginning but it felt like a significant milestone was reached this week. The work of the second technical sprint drew on the groundwork previously completed in compiling user stories from discussion with the stakeholders and making a great effort to understand the customer requirements. Mark Fendley did sterling work in marshalling this work and creating the story cards – a master Scrum master.  We had committed to delivering wireframes for homepage and data entry screens and a minimum viable product – a working model with at least five editable fields. However the time invested in evaluating the best platform and framework for the application really paid off allowing the developers to leapfrog over many of the wireframes and produce a working model with a really good looking user interface. The initial feedback from the customer has been really positive and this great job from the development team has really boosted the project.

Of course these are early days in the development of what we are currently calling the Programme Plant but this is a good start. Currently the model only exists on a webteam laptops so cusotmers have not been able to get any hands on experience. A component needed by the application was not available on the server so we had to compromise. This component will be inplace by mid-June prior to the next technical sprint. In the next sprint we will begin load testing – something we are committed to doing at every stage of the development.

Those interested in some technical detail on the experience of the developers in working with the chosen platform – PHP on a Laravel framework – are recommended to check Matt Bull’s blog and comments from others which can be found here:  Webdev blog

This week we will present the working model to other stakeholders and seek further feedback. We are committed to incremental development and will spend some time before the next sprint – which begins on 14th June – analysing feedback and looking again at the users stories.

Well done to all involved in the project!

Standard

Another technical sprint begins

Bare tree reflected in pond

Blue skies reflected in a campus pond

Today marks the beginning of another two week technical sprint on the project. This follows the inaugural Steering Group held on Monday, which endorsed the team’s recommendation that we should  develop a new Programmes Factory from the ground up using PHP. A couple of days later we held a very succesful planning session with  our colleagues from EMS and took delivery of  Angela Watson’s excellent handiwork – the core list of data fields.

Mark Fendley, our scrum master  then prepared user story cards from what turned out to be a very useful planning meeting. The project  start period was always going to feel a bit slow with lots of talking and apparently not much happening – though this was a very necessary stage. It now feels that we are entering a much more ‘hands on’ phase.

By the end of this sprint we should have created the basic data model, though we expect to have to tweak it a little as the project progresses, and have created a ‘proof of concept’ user interface form. This will allow us to seed the database with test data and to perform some early load testing.

As mentioned before we want to deliver  the application incrementally to our customers and seek reviews and endorsements for each stage of development. Here’s hoping for a suceesful retrospective at the end of this sprint.

Standard

A quick project update

A pile of carved wooden books and a bench at an outside meeting place on the University of Kent campus

Outside meeting space, Canterbury Campus, University of Kent

The first technical sprint is now over and the project developers have produced their recommendations for a development platform. The current Programmes Factory software is a Drupal application and I think it is fair to say it has its problems. Users find it slow – particularly if there is more than one user  – and the developers had some issues with the data model. In summary, neither side, developers or users were keen to redevelop on this platform. However time had been invested in acquiring expertise in Drupal and there are other Drupal applications in use and supported by IS so the decision to drop it as a development platform should not be taken lightly. Ultimately the Project Steering Group will decide whether to approve the  team’s decision. I won’t pre-empt that by rehearsing all the arguments here but the platforms we were originally considering were:

  • Drupal
  • Microsoft .NET framework
  • PHP
  • Sharepoint

The best laid plans of mice and programmers being what they are however a latecomer has popped up in the form of Python on a Django framework. The EMS team are considering a third party application to produce customised Prospectus pdfs and there may be good reasons for settling on a platform that best fits with that system  – which uses Django. Trouble is we need a technical spike to make that decision. We can do this but it may push back work already scheduled. Next week sees the first meeting of the project Steering Group – that is where the decision whether to spike or not will be taken.
The development platform is important but not more so than the system architecture. The course data system will be web service oriented with a service bus at its core. The data management tool we build will produce a web service which will be used by the central core aggregator. By aggregating data from disparate web services  the central service bus will provide other web services – including the open XCRI feed. The central bus should be platform agnostic towards its web service suppliers. It will also need to have good performance and be fully extensible.

——————————————————————————————————-

An interesting article in the Chronicle of Higher Education reveals how far ahead the UK are – though we are not alone in this – with open course data in comparison to the United States. One of the lessons to be learned from the article is that if institutions do not provide the data students, alumni and prospective students feel they need to make their decisions they will find other ways of getting it. Of course statistics are  not the only measure of value in Higher Education but we can surely trust our customers to work that out for themselves?

Standard

K.I.S. and tell

Distant view of Canterbury Cathedral on bright but misty day

Morning mist over Kent campus

We have added an item to the work packages for Kent’s XCRI-CAP project – namely configuration and implementation of the KIS widget. Key Information Sets are comparable sets of standardised information about undergraduate courses. In an increasingly competitive market, and in an online world where customers are used to being able to make comparisons, HEIs need to make relevant information easily accessible to prospective students. People browsing the prospectus want to know about the experience of previous students and what their prospects might be after graduation  as well as details of the courses on offer. The information provided by KIS differs from the XCRI-CAP feeds in that it includes data from, amongst other sources,  the annual student survey. Crucially it is also  presented in context on the same page as the course information

Final details of the appearance and contents of the widget are not released until the end of this month (March 2012) but the widget will include data such as:

  • Student satisfaction
  • Percentage of graduates of the course in work after six months
  • Average salary of graduates of the course

The data will be aggregated in part from national data sets, such as the National Student Survey (NSS) and the Higher Education Statistics Agency (HESA) and the Destination of Leavers from Higher Education (DLHE) survey. But data on learning and teaching, assessment methods, accommodation etc will need to be submitted by HEIs initially to HEFCE. In the future HESA will collect this data.

The KIS widget which will be embedded on each page of the online prospectus – much like one might embed a YouTube video – and will display data pulled direct from the aggregating HEFCE website which will be launched in the autumn of 2012.

Much of the data displayed in the KIS widget is currently available from the Unistats website but the widget will display the data with the programme to which it refers. The user will also be able to click through to the Unistats website (or more accurately its replacement) to see further information on the course, the institution and information about the local facilities, rental prices and etc

(Further information on KIS from HEFCE).

Standard

Beginning at the beginning

Pile of Kent ProspectusesHaving talked with the project’s stakeholders we decided that our investigation of the circuituous journey of a new programme or module towards its inclusion in a printed or on-line prospectus should begin at the beginning. This may seem obvious but perhaps not when you consider that the project scope does not include the delivery of a system to streamline, automate and disseminate the creation of programmes and modules. There is no doubt there is a need to improve current methods of working but we do not have sufficient resources within the XCRI project to achieve this. The processes we are looking at in this project begin after a new programme or module has been entered (currently manually) onto the Student Data System.

However in order to ‘future proof’ our developments as far as possible we need to understand the whole process  – so this is where we have started. David Sweet & Leo Lyons spent time talking to Ann Tull in the Faculty Office and as a result David, the Information Services Systems Architecture Analyst has produced a first draft of a schematic illustrating the programme/module creation process. After comments and clarification from Ann we should have the first visualisation of at least the begining of the course data journey.

As well as starting to appreciate just how convoluted and complex the processes can be one can’t help but be impressed by the knowledge and dedication of the individuals involved – transporting the germ of an idea through to its appearance on-line or in print. I thank them for their patience in explaining to me what is second nature to them!


Standard

Using stories to see the big picture

Frozen water and felled trees on the Univeristy campus

Frozen water and felled trees on the Univeristy campus

Most of the administrative stuff is in place now -Implementation Group meeting regularly, stakeholders identified and on-board and project manager appointed (me!). David Sweet, our Systems Archtiecture Analyst has begun the process of mapping out current processess and workflows. The Project Team has spent time creating the ‘epic’ user stories, giving them values and acceptance criteria and getting all that into Sharepoint. The Agile approach means that we create user stories, written originally on postcards, with wording in this format:

As a (role), I would like (desire/goal),So that (benefit)

We then prioritise these user stories and begin to break them down into tasks. Members of the project team can view the users stories and their rankings on the Project Sharepoint site.

This phase is unsurprisingly one which features many, many questions for the team but we are now starting to see a way forward and have planned our first sprint for the end of the month. This is when the developers will evaluate current systems and look at the alternatives available so we can settle on a platform. To outside observers it may seem that not much is happening but that is not the case. Once we have a clear path and identified which tasks are to be tackled first the actual developemnt work of the project can begin.

As always with the early phases of projects we are struggling with potential scope creep but determined to keep a lid on it. It being better to have realistic goals and to deliver quality solutions than to take on too much and be mediocre.

Standard

Mapping what we have to ensure we get what we need

Modern glass building in Paddington against a clear blue winter sky

Paddington skyline in winter

Matt Bull and I braved the ice and snow to go up to London for the XCRI Programme Meeting last week. Only they didn’t really have any ice or snow in London. It was a well-attended event and for much of the day we split into small groups to explore possibilities for collaboration and mutual support. There was less overlap than might have been expected in terms of systems currently used for storing course data but overall participants seemed to be pretty relaxed and confident about producing the desired XCRI feeds.

As at Kent, most institutions involved – a mixture of FEIs and HEIs – were also intending to review current workflows for production of both web and paper based course information. It was more or less universally agreed that it was these work packages that might prove more problematical so it was good to hear people’s ideas and at least feel we were not alone. The aims of the project make a lot of sense to all our stakeholders – we all have the same goals – but the path we take to implement changes and the way we schedule the work will need careful planning and buy in from all those likely to be affected. We will end up with a more efficient, less fractured way of working and less disconnected data stores and duplication. But the day-to-day work of those involved in compiling, editing and publishing the data has to continue during the development process. The work of the project inevitably will have an impact on this – though we will strive to keep this to a minimum.  It is vital that the communications channels stay open and that we design the work packages well. We are going to use an Agile methodology with a time-boxed iterative approach, regular reviews and a commitment to rapid and flexible response to change. It is early days in the XCRI project but I know from previous experience that work put into agreeing the way forward with stakeholders and the adoption of a robust working framework will pay dividends later.

With this in mind our first major task will be to create a detailed map of current data stores and data outputs and to analyse the processes that get the data from one to the other. Then we should know who we need to talk to as well as what we need to do.

Standard

XCRI-CAP project launched

Crane against evening sky

A Crane against the evening sky above Kent's new music centre site

XCRI-CAP? Not perhaps the most elegant of acronyms but it stands for the  following:

 eXchanging Course Related Information – Course Advertising Profile

In a nutshell this project aims to consolidate all the data the University holds on its courses, programmes and modules into a nationally agreed format.

This data is used for many purposes both internally and externally – for  online and printed prospectuses, for Key Information Sets and for the Higher Education Achievement Report. The project will ensure our data is compliant with the UK standard for describing course related material, will reduce the need for re-keying information and look at improving workflows  and rationalising current disparate datastores.

The Kent XCRI-CAP is a JISC funded project and is a joint effort between the Enrolment Management Service and the IS Web Development Team.  JISC is funding similar projects at sixty three HEIs.

Initial meetings have already taken place involving staff who will be working on the project. Further details  will appear here very shortly.

Standard