

I have found that one of the most rewarding parts of studying Economics has been learning to problem solve. It’s all well and good learning economic theories and drawing fancy diagrams, but if you can’t figure out things yourself, then where is the sense of achievement? Learning to code empowers you to find out new things, explore what interests you, and stretch yourself.
Whether this is Stata, R, Python, or Julia, I would highly recommend that you learn one of them. Stata is fantastic for simple Econometric analysis and is user-friendly. R takes longer to get started with but is much more powerful and flexible, with some great capabilities for data analysis. Python is more for simulations and general data analysis, albeit with some packages for Econometric analysis (statsmodels). Finally, Julia is similar to Python, but useful for Financial Economics (although I’ve not explored it much!).
The basics are documented online well and YouTube tutorials will take you only a couple of hours to get setup (e.g. https://www.youtube.com/c/TheJuliaLanguage), with other online resources to teach the basics (https://www.w3schools.com/python/python_intro.asp). I have also begun posting the basics of Python on my website, with more to follow soon: https://joelpointon.com/2021/02/24/introduction-to-python-and-economics/
But once you get started, overcoming errors and bugs requires experience. That’s where Kenometrics steps in. The Economics department hosts a 2-hour session every Friday at 4 (during term-time) where experienced PhD students dedicate their time to help students with their issues. Usually it is in-person, but this year it has been hosted on Teams.
Being able to screenshare code and ask Guillermo to cast his eyes over my work has been amazingly helpful. He knows about time-saving functions that I have never even heard of! It is this kind of experience that googling can’t really compete with. Sometimes you need someone to get ‘stuck-in’ with the nuances of your code and help guide you to a solution.
The best way to learn is by trying and making mistakes. Even today I’ve spent around 3-4 hours trying to debug issues with my time series Econometrics, it can be tedious, but once it works, it is so rewarding. Then, once you get started on one language, you can easily pickup another language. If you can play the guitar then you will be able to pick up a bass with relative ease.
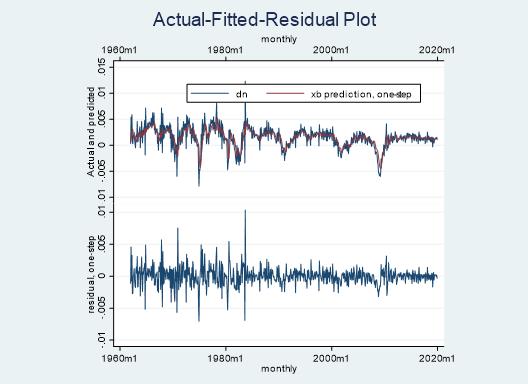
If you’re not sure what to code, then there are great starter projects online. Alternatively, if you see something done in Excel or similar, try to replicate it with one of the above programming languages. Last week I created this graph to replicate E-Views, because I wanted to use Stata to run my Time-Series Econometrics.
So, get started with the basics, try to run some code, and then head to Kenometrics to get the support of Guillermo, Yasmine, and others!
All details about Kenometrics can be found here -a centralized hub for recommended online resources and a yearlong support in the use of Econometrics software (Stata, Eviews, R and a little bit of Julia).